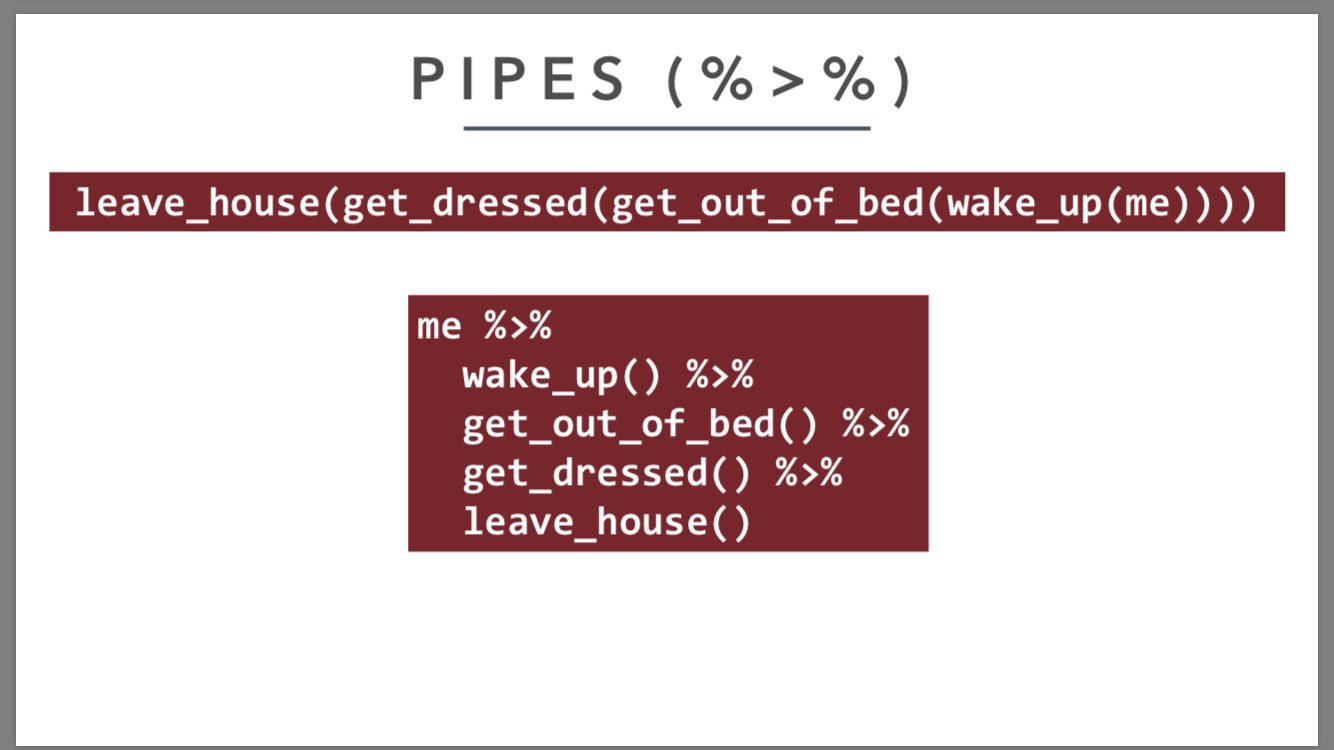
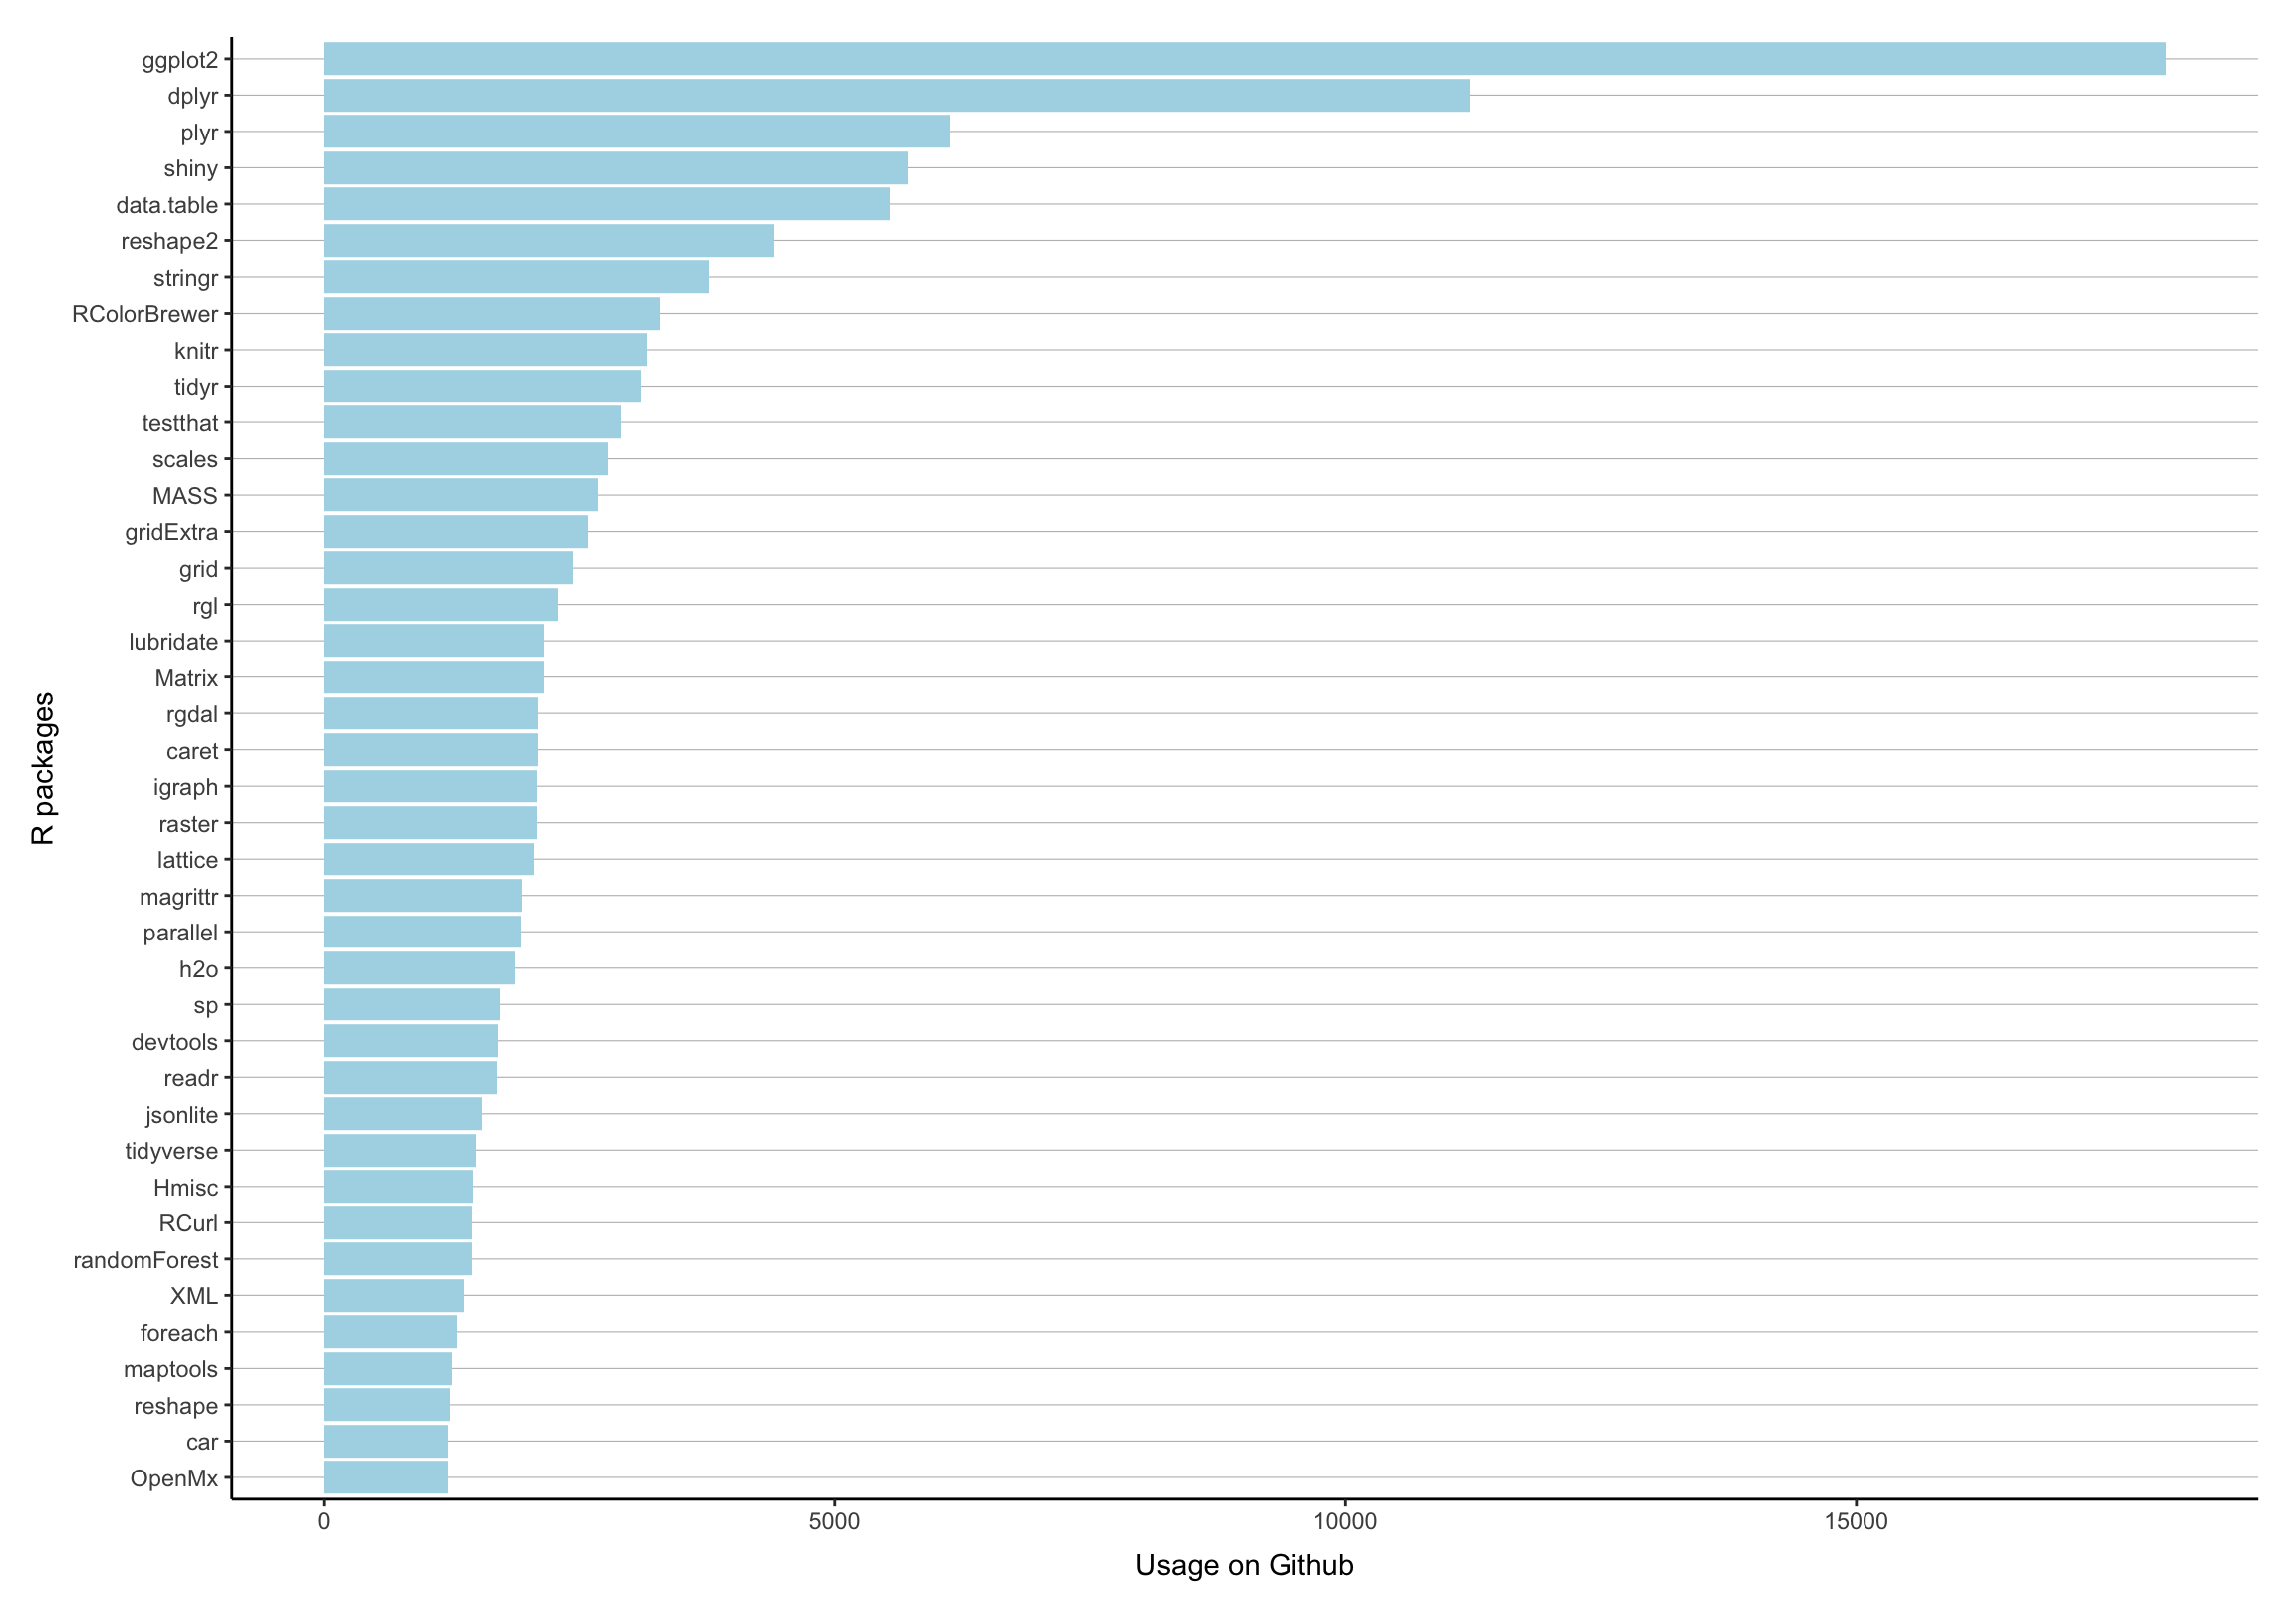
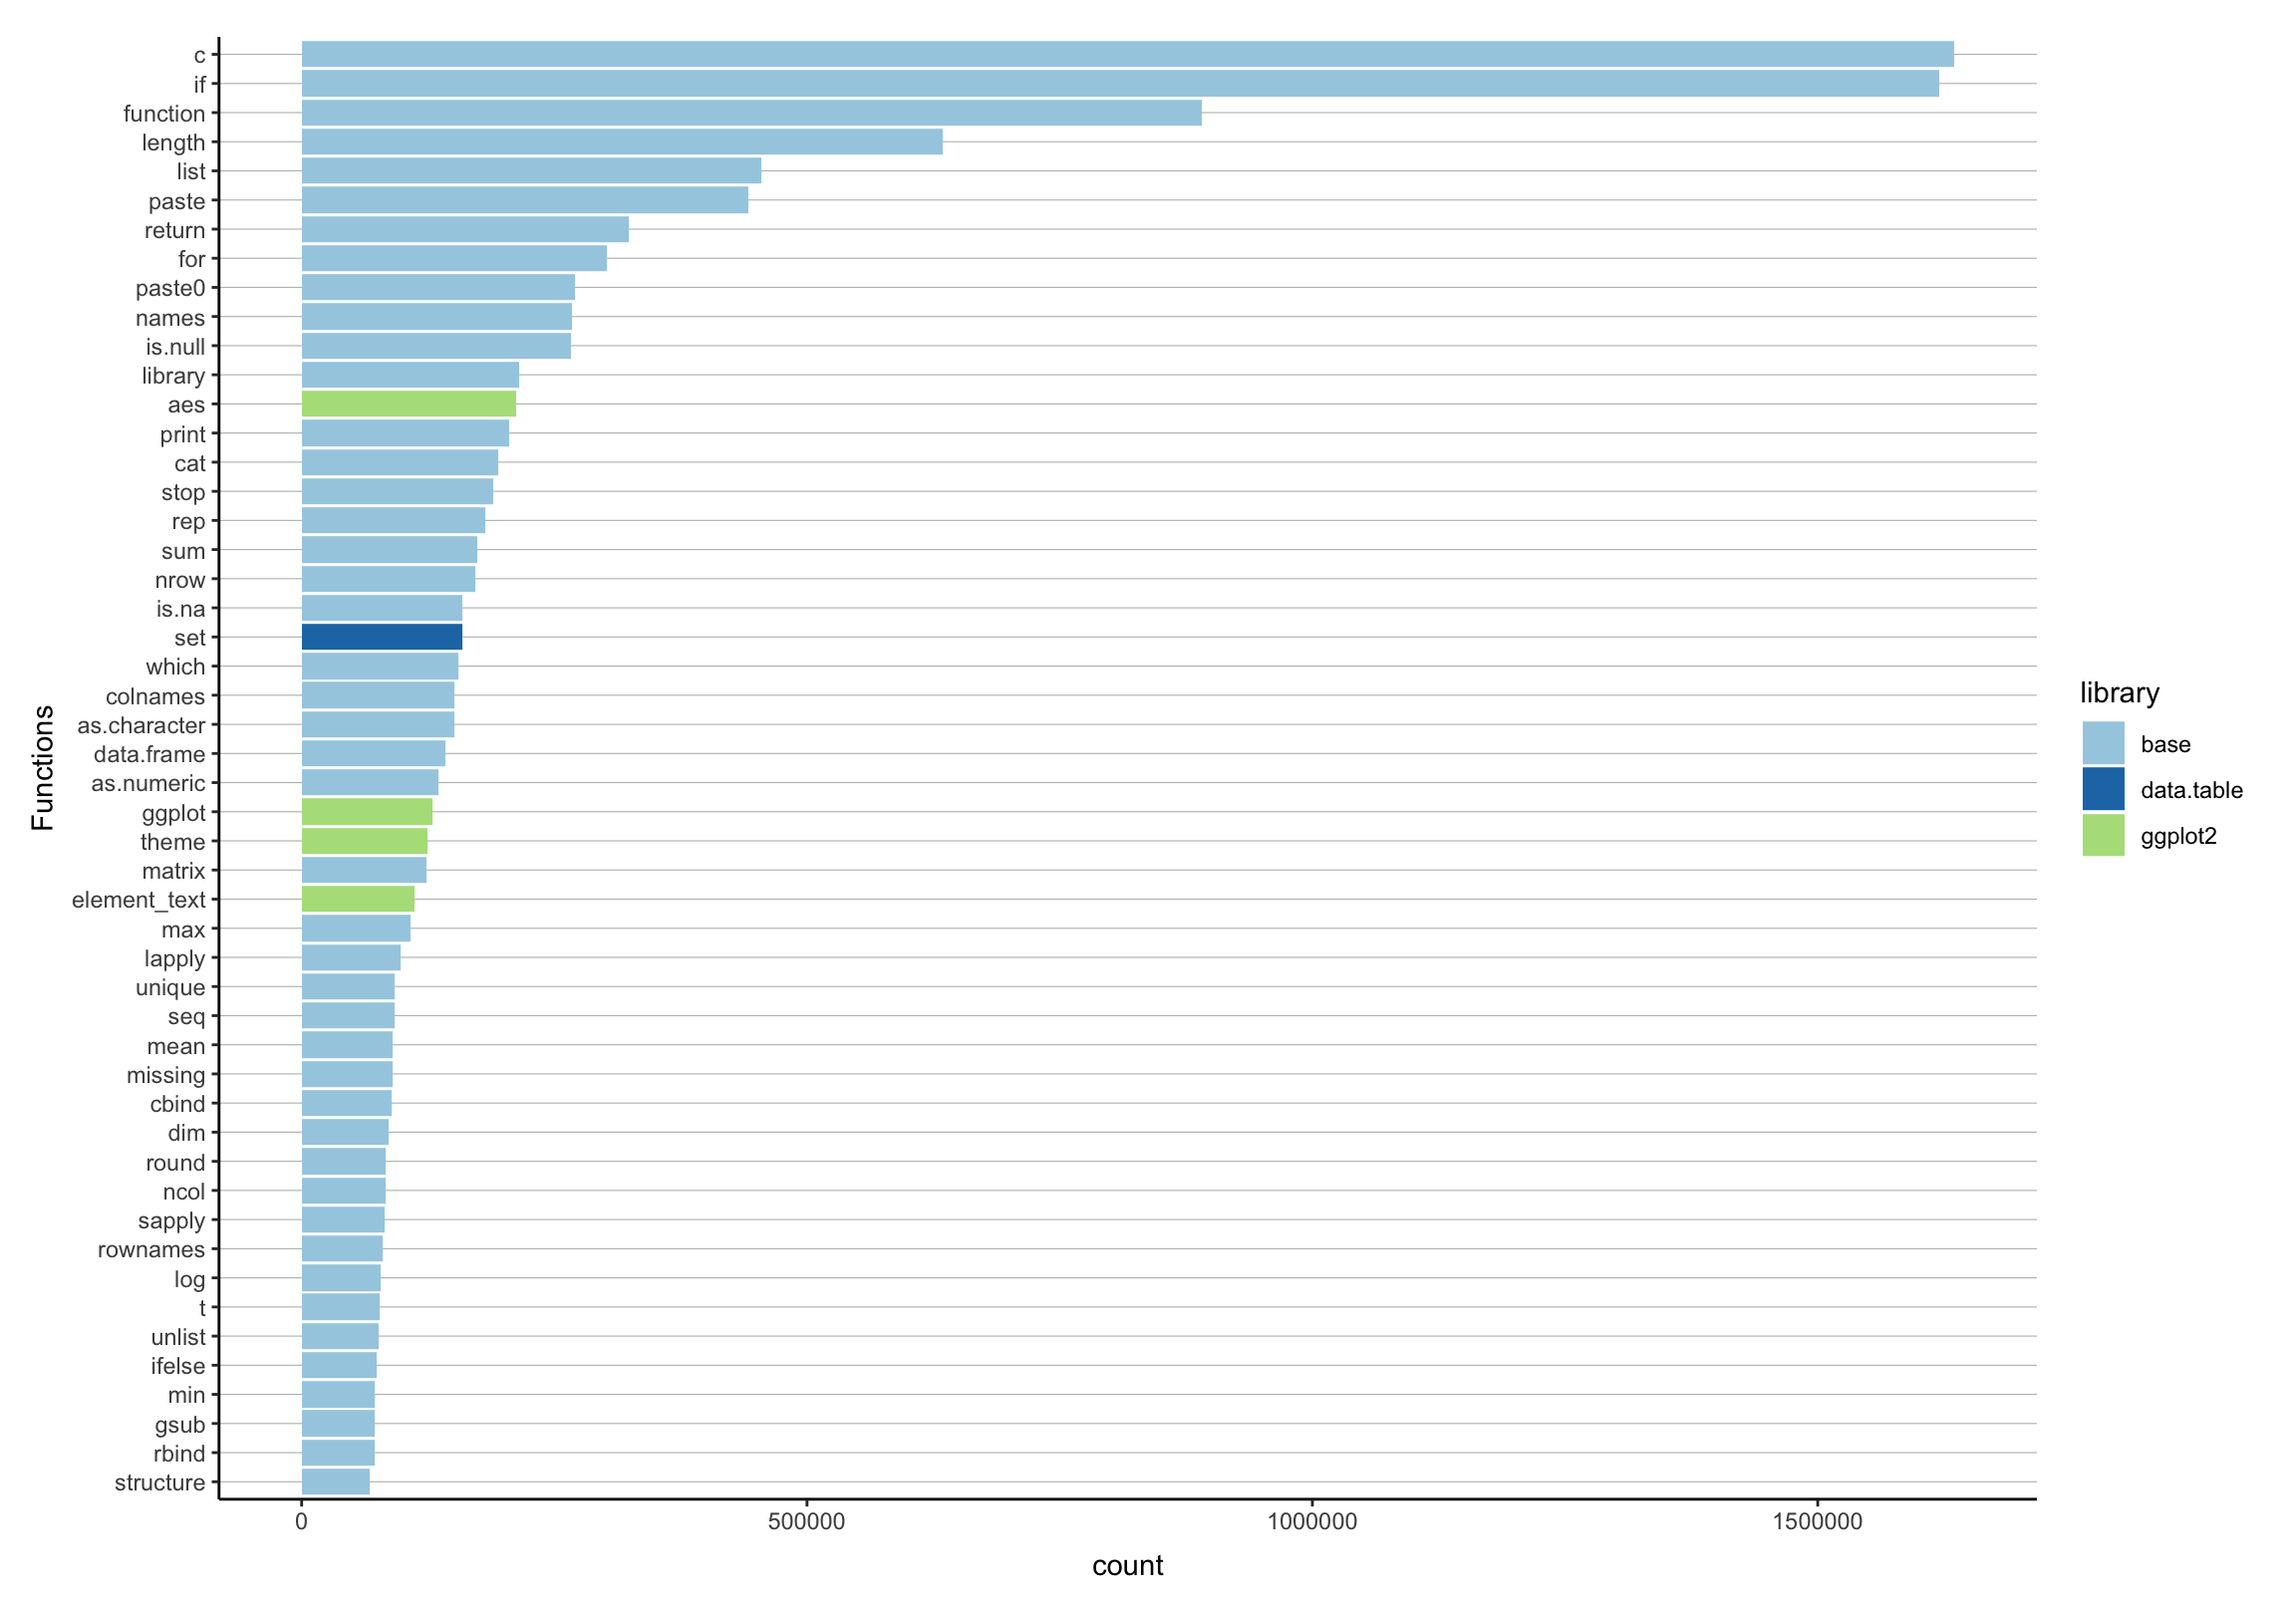
Extrasitzung
Einfach Textdateien speichern
Daten
##                         name      genus  vore        order conservation
## 1                    Cheetah   Acinonyx carni    Carnivora           lc
## 2                 Owl monkey      Aotus  omni     Primates         <NA>
## 3            Mountain beaver Aplodontia herbi     Rodentia           nt
## 4 Greater short-tailed shrew    Blarina  omni Soricomorpha           lc
## 5                        Cow        Bos herbi Artiodactyla domesticated
## 6           Three-toed sloth   Bradypus herbi       Pilosa         <NA>
##   sleep_total sleep_rem sleep_cycle awake brainwt  bodywt
## 1        12.1        NA          NA  11.9      NA  50.000
## 2        17.0       1.8          NA   7.0 0.01550   0.480
## 3        14.4       2.4          NA   9.6      NA   1.350
## 4        14.9       2.3     0.13333   9.1 0.00029   0.019
## 5         4.0       0.7     0.66667  20.0 0.42300 600.000
## 6        14.4       2.2     0.76667   9.6      NA   3.850
sink
- Auch im Arbeitsverzeichnis (\(\rightarrow\)
getwd) caterzeugt den Textstring in seinem Argument auch in der Textdatei, nützlich für Titel, wenn mehrere Berechnungen in dieselbe Datei sollen\nerzeugt einen Zeilenumbruch- Mit
witherspart man sich ein kleines bisschen Schreibarbeit, weil man den Datensatz selbst nicht immer wieder innerhalb der Funktion eingeben muss - Wichtig:
sinkimmer mitsinkbeenden, wenn die Textdatei alle Infos enthält, die man abspeichern wollte
Funktionen aus dem tidyverse
Funktionen, die man kennen sollte
Beispiele
# Spalte für Faktor Issueness anlegen
d <- mutate(d, issue = case_when(
  str_detect(d$V8, "_at") ~ "at-issue",
str_detect(d$V8, "_non") ~ "non-at-issue"))Weitere Beispiele
Mit dem altbekannten Diamantendatenset:
##   carat       cut color clarity depth table price    x    y    z
## 1  0.23     Ideal     E     SI2  61.5    55   326 3.95 3.98 2.43
## 2  0.21   Premium     E     SI1  59.8    61   326 3.89 3.84 2.31
## 3  0.23      Good     E     VS1  56.9    65   327 4.05 4.07 2.31
## 4  0.29   Premium     I     VS2  62.4    58   334 4.20 4.23 2.63
## 5  0.31      Good     J     SI2  63.3    58   335 4.34 4.35 2.75
## 6  0.24 Very Good     J    VVS2  62.8    57   336 3.94 3.96 2.48
Vorkommen zählen
## # A tibble: 6 x 3
##   color cut           n
##   <ord> <ord>     <int>
## 1 D     Fair        163
## 2 D     Good        662
## 3 D     Very Good  1513
## 4 D     Premium    1603
## 5 D     Ideal      2834
## 6 E     Fair        224
Zählen und Sortieren
## # A tibble: 6 x 3
##   color cut       n
##   <ord> <ord> <int>
## 1 J     Fair    119
## 2 D     Fair    163
## 3 I     Fair    175
## 4 E     Fair    224
## 5 H     Fair    303
## 6 J     Good    307
Sortieren und Spalten auswählen
##   price carat color       cut
## 1 18823  2.29     I   Premium
## 2 18818  2.00     G Very Good
## 3 18806  1.51     G     Ideal
## 4 18804  2.07     G     Ideal
## 5 18803  2.00     H Very Good
## 6 18797  2.29     I   Premium
Gruppieren und rechnen
## # A tibble: 7 x 3
##   color mprice medprice
##   <ord>  <dbl>    <dbl>
## 1 D      3170.    1838
## 2 E      3077.    1739
## 3 F      3725.    2344.
## 4 G      3999.    2242
## 5 H      4487.    3460
## 6 I      5092.    3730
## 7 J      5324.    4234
Gruppieren, berechnen, filtern
# nach schliff gruppieren
# spalte mit mittlerem preis hinzufügen
# und maximale verkaufspreise anzeigen lassen
d %>% group_by(cut) %>%
  mutate(mprice = mean(price)) %>%
  filter(price == max(price))
## # A tibble: 5 x 11
## # Groups: cut [5]
## carat cut color clarity depth table price x y z mprice
## <dbl> <ord> <ord> <ord> <dbl> <dbl> <int> <dbl> <dbl> <dbl> <dbl>
## 1 2.01 Fair G SI1 70.6 64 18574 7.43 6.64 4.69 4359.
## 2 2.8 Good G SI2 63.8 58 18788 8.9 8.85 0 3929.
## 3 1.51 Ideal G IF 61.7 55 18806 7.37 7.41 4.56 3458.
## 4 2 Very Good G SI1 63.5 56 18818 7.9 7.97 5.04 3982.
## 5 2.29 Premium I VS2 60.8 60 18823 8.5 8.47 5.16 4584.Gruppenkorrelationen plotten
# nach farbe gruppieren
# und korrelation zwischen preis und gewicht berechnen
# und plotten
d %>% group_by(color) %>%
  summarise(price_carat_cor = cor(price, carat)) %>%
  ggplot(aes(color, price_carat_cor, group = 1)) +
  geom_path()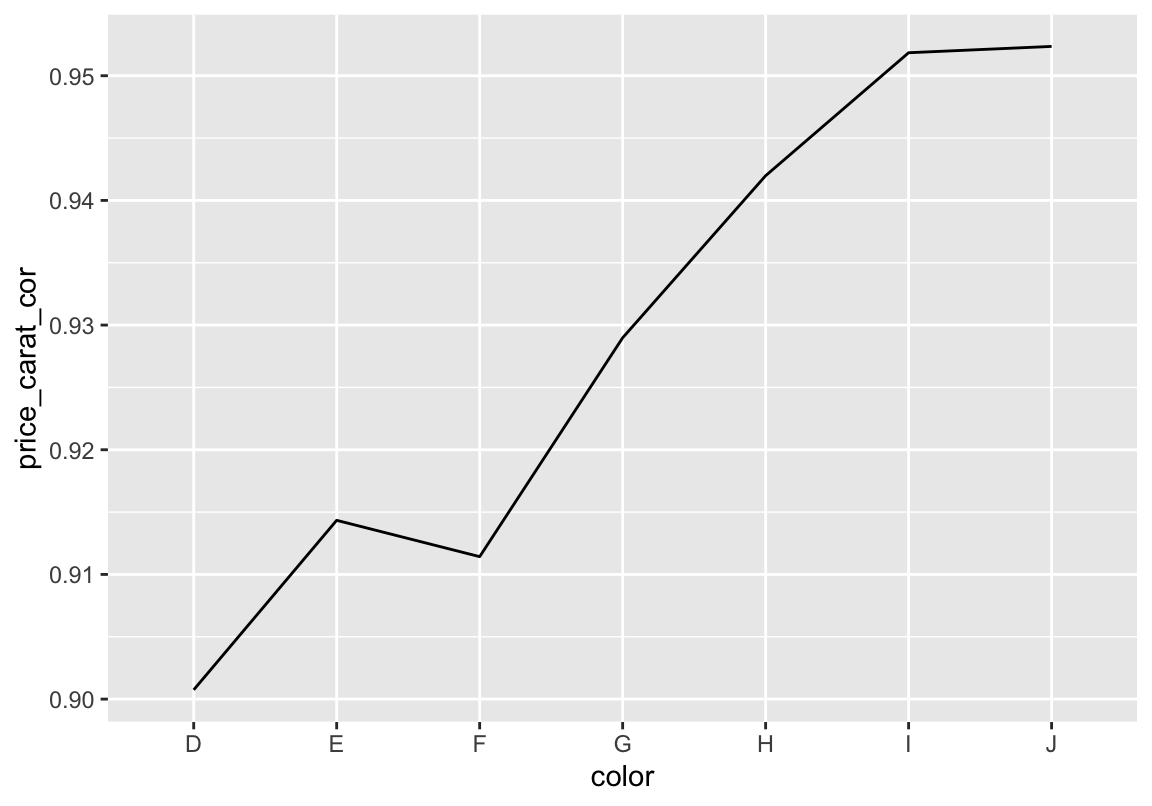
Filtern und plotten
# nur zeilen mit preis > 15000 und schliff == Fair
# im plot darstellen
d %>% filter(price > 15000, cut == "Fair") %>%
  ggplot(aes(carat, price)) +
  geom_point()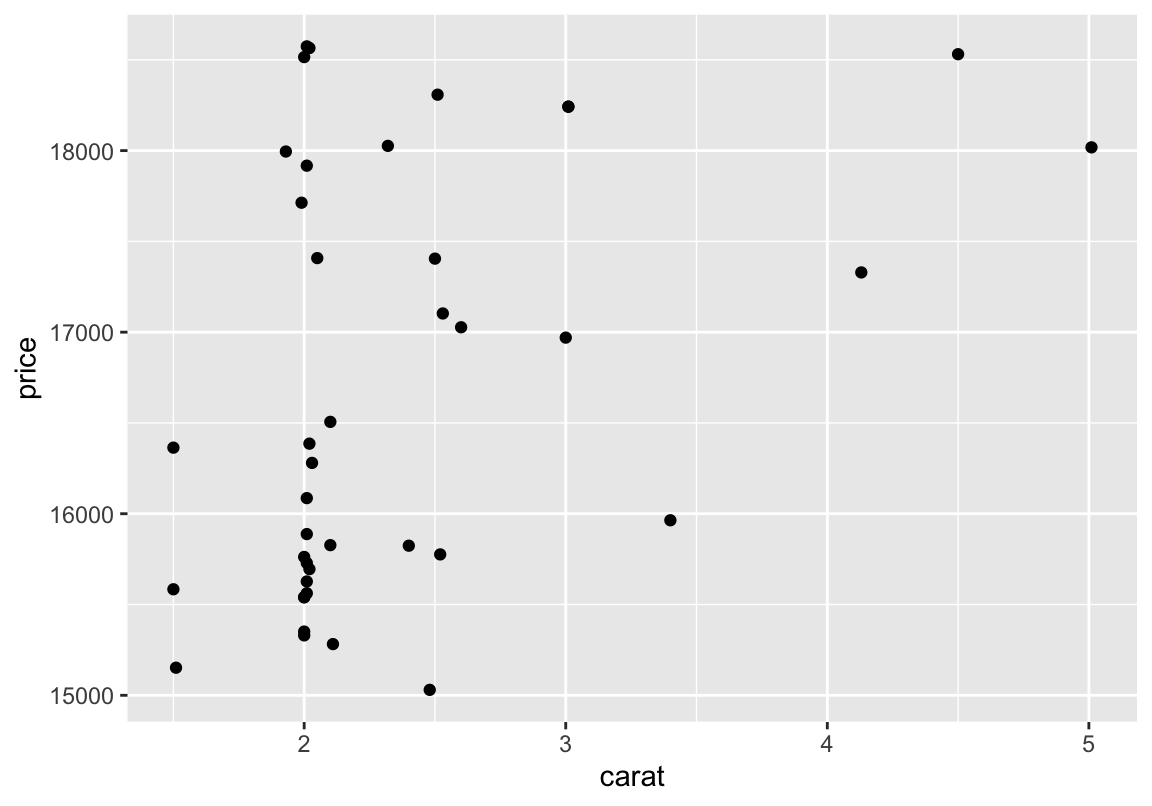
Speed-Up
Bei größeren Datensätzen (Korpusdaten, EGG, Eye-Tracking) kann es vorkommen, dass die inhärenten Funktionen von R und dem tidyverse zu langsam sind. Wem eine solche Situation häufiger unterkommt, sollte es sich überlegen, die unteren beiden Pakete in seinen Workflow zu integrieren. Beide bieten tidyverse-Syntax mit der Geschwindigkeit von data.table, einem Paket, das zwar wesentlich schneller als andere Lösungen ist, aber einiges an Komplexität mit sich bringt.
For-Loops
Loops
# ausgabe aller geraden zahlen zwischen 1 und 15
for (i in 1:15) { # 1:15 = zahlenreihe 1 bis 15
  if (i %% 2) { # wenn die jeweilige zahl durch 2 teilbar ist, ...
    next} # dann gehe zum nächsten Schritt und
  print(i) # gib sie aus
}
## [1] 2
## [1] 4
## [1] 6
## [1] 8
## [1] 10
## [1] 12
## [1] 14Loops
# summe: x_1 + x_2 + ... + x_n
my.sum <- function(vector) {
  sum <- 0 # ist nötig, damit wir immer wieder neu bei
  # null beginnen, wenn wir die funktion nochmal benutzen wollen
  for (i in vector) {sum <- sum + i
  }
  sum
}

a <- c(1, 2, 3, 4, 5, 6)
my.sum(a)
## [1] 21## [1] 21## [1] 21Übung
- Schreibe eine Funktion “my.mean”, die den Mittelwert eines Vektors berechnet
- Schreibe eine Funktion “my.var”, die die Varianz eines Vektors berechnet
Lösungen
- Schreibe eine Funktion “my.mean”, die den Mittelwert eines Vektors berechnet
# mittelwert: (x_1 + x_2 + ... + x_n)/n
my.mean <- function(vector) {
  sum <- 0 # wie oben
  for (i in vector) {
    sum <- sum + i
  }
  sum / length(vector)
}
a <- c(1, 2, 3, 4, 5, 6)
my.mean(a) == mean(a)
## [1] TRUE## [1] 3.5Lösungen
- Schreibe eine Funktion “my.var”, die die Varianz eines Vektors berechnet
# varianz:
# ((x_1-x_mittelwert)+(x_n-x_mittelwert) ... + (x_n-x_mittelwert))/n
my.var <- function(vector) {
  sum <- 0
  meanie <- my.mean(vector)
  for (i in vector) {
    sum <- sum + (i - meanie)^2
  }
  sum / (length(vector) - 1)
}
my.var(a) == var(a)
## [1] TRUE## [1] 3.5Funktionen, die das Coden erleichtern
Daten
##   count spray
## 1    10     A
## 2     7     A
## 3    20     A
## 4    14     A
## 5    14     A
## 6 12 A## 'data.frame': 72 obs. of 2 variables:
## $ count: num 10 7 20 14 14 12 10 23 17 20 ...
## $ spray: Factor w/ 6 levels "A","B","C","D",..: 1 1 1 1 1 1 1 1 1 1 ...by()
## d$spray: A
## [1] 14.5
## ------------------------------------------------------------
## d$spray: B
## [1] 15.333
## ------------------------------------------------------------
## d$spray: C
## [1] 2.0833
## ------------------------------------------------------------
## d$spray: D
## [1] 4.9167
## ------------------------------------------------------------
## d$spray: E
## [1] 3.5
## ------------------------------------------------------------
## d$spray: F
## [1] 16.667
with()
Struktur:
- with(Variable, Befehl/Funktion)
Der Befehl/die Funktion innerhalb von within wird mit der angegebenen Variable durchgeführt
with()
Hier die Daten, mit denen ich die Funktionsweise von with illustrieren werde:
##    len supp dose
## 1  4.2   VC  0.5
## 2 11.5   VC  0.5
## 3  7.3   VC  0.5
## 4  5.8   VC  0.5
## 5  6.4   VC  0.5
## 6 10.0 VC 0.5## 'data.frame': 60 obs. of 3 variables:
## $ len : num 4.2 11.5 7.3 5.8 6.4 10 11.2 11.2 5.2 7 ...
## $ supp: Factor w/ 2 levels "OJ","VC": 2 2 2 2 2 2 2 2 2 2 ...
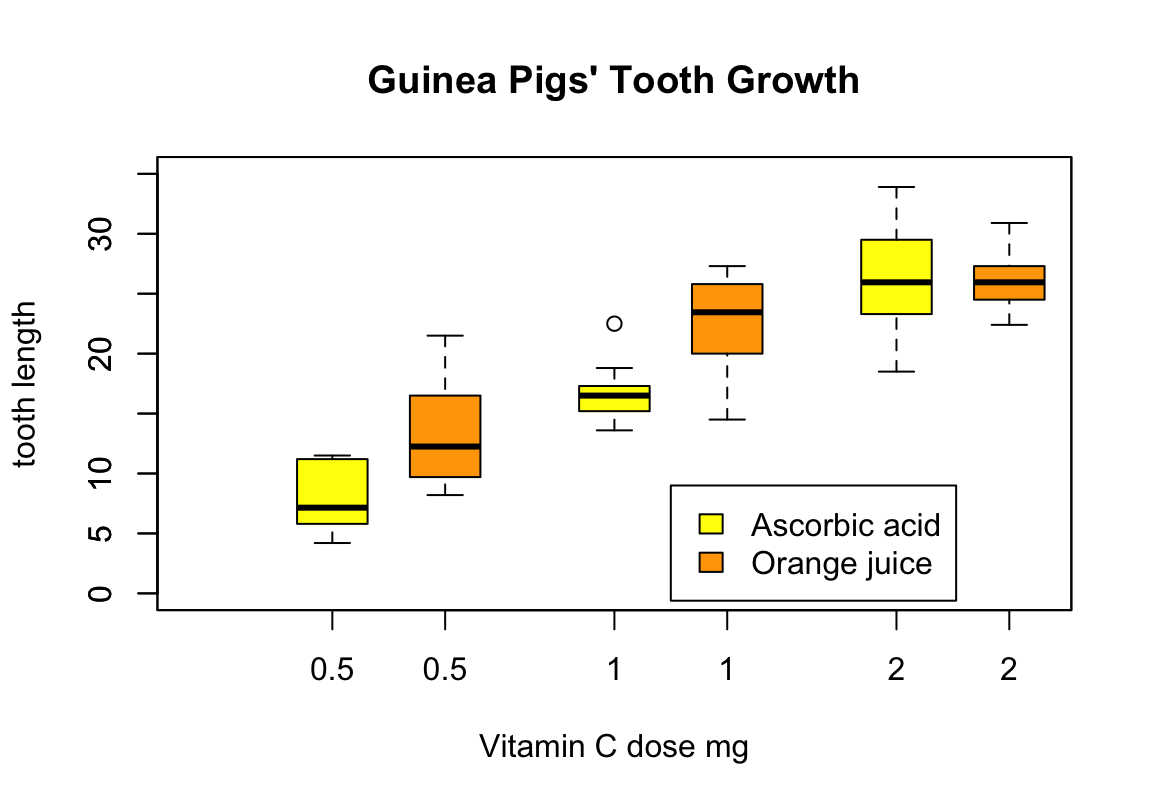
## $ dose: num 0.5 0.5 0.5 0.5 0.5 0.5 0.5 0.5 0.5 0.5 ...with()
with(ToothGrowth, {
  boxplot(len ~ dose, boxwex = 0.25, at = 1:3 - 0.2,
    subset = (supp == "VC"), col = "yellow",
    main = "Guinea Pigs' Tooth Growth",
    xlab = "Vitamin C dose mg",
    ylab = "tooth length", ylim = c(0, 35))
  boxplot(len ~ dose, add = TRUE, boxwex = 0.25, at = 1:3 + 0.2,
    subset = supp == "OJ", col = "orange")
  legend(2, 9, c("Ascorbic acid", "Orange juice"),
    fill = c("yellow", "orange"))
})
attach()
Alle folgenden Befehle werden mit der angegebenen Variable ausgeführt
Eignet sich, wenn mit wenigen Tabellen/Variablen gleichzeitig gearbeitet wird
Eine Variable, die mit attach ausgewählt wurde, kann mit
detachwieder entfernt werden, wenn beispielsweise eine neue Variable verwendet werden sollWarnung: Google sagt:
Don’t use attach() The possibilities for creating errors when using attach() are numerous.
## [1] 9.5## [1] 7.2033## [1] 7## [1] 5apply()-Familie
tapply(Vektorvariable/Spaltenvariable, INDEX = Vektorvariable/Spalte, Befehl)
- für Tabellen/Data-frames
- Als zweites Argument muss eine Spalte angegeben werden, nach deren Inhalt die
Funktion ausgeführt wird
- Es werden quasi Subsets nach dem Inhalt der angegebenen Spalte erstellt, über die dann einzeln der Befehl angewandt wird.
- Alternative Befehle:
sapply,lapply
apply()-Familie
# Berechnet Mittelwert und Median der Insektenanzahl
# für den jeweiligen Typ von Insektenspray
tapply(d$count, d$spray, mean)
## A B C D E F
## 14.5000 15.3333 2.0833 4.9167 3.5000 16.6667## A B C D E F
## 14.0 16.5 1.5 5.0 3.0 15.0Unterschied by() und tapply()
Janitor-Paket
Bessere Häufigkeitstabellen
- Alternative zu
table - Gibt Ergebnisse als data frame aus
##  color Fair Good Very Good Premium Ideal
##      D  163  662      1513    1603  2834
##      E  224  933      2400    2337  3903
##      F  312  909      2164    2331  3826
##      G  314  871      2299    2924  4884
##      H  303  702      1824    2360  3115
##      I  175  522      1204    1428  2093
## J 119 307 678 808 896## color Fair Good Very Good Premium Ideal
## D 0.024059 0.097712 0.22332 0.23661 0.41830
## E 0.022864 0.095233 0.24497 0.23854 0.39839
## F 0.032698 0.095263 0.22679 0.24429 0.40096
## G 0.027807 0.077134 0.20360 0.25894 0.43252
## H 0.036488 0.084538 0.21965 0.28420 0.37512
## I 0.032276 0.096274 0.22206 0.26337 0.38602
## J 0.042379 0.109330 0.24145 0.28775 0.31909Bessere Häufigkeitstabellen
denominator-Argument verändert, wie Häufigkeiten berechnet werdenadorn_pct_formatting: *100 plus %- zusätzlich möglich:
adorn_totals
##  color  Fair  Good Very Good Premium Ideal
##      D 10.1% 13.5%     12.5%   11.6% 13.2%
##      E 13.9% 19.0%     19.9%   16.9% 18.1%
##      F 19.4% 18.5%     17.9%   16.9% 17.8%
##      G 19.5% 17.8%     19.0%   21.2% 22.7%
##      H 18.8% 14.3%     15.1%   17.1% 14.5%
##      I 10.9% 10.6%     10.0%   10.4%  9.7%
## J 7.4% 6.3% 5.6% 5.9% 4.2%## color Fair Good Very Good Premium Ideal
## D 0.3% 1.2% 2.8% 3.0% 5.3%
## E 0.4% 1.7% 4.4% 4.3% 7.2%
## F 0.6% 1.7% 4.0% 4.3% 7.1%
## G 0.6% 1.6% 4.3% 5.4% 9.1%
## H 0.6% 1.3% 3.4% 4.4% 5.8%
## I 0.3% 1.0% 2.2% 2.6% 3.9%
## J 0.2% 0.6% 1.3% 1.5% 1.7%Leere Zeilen und Spalten entfernen
##   v1 v2   v3
## 1  1 NA    a
## 2 NA NA <NA>
## 3 3 NA b## v1 v3
## 1 1 a
## 3 3 bSpalten mit konstanten Werten entfernen
##   good   boring
## 1    1 the same
## 2    2 the same
## 3 3 the same## good
## 1 1
## 2 2
## 3 3clean_names()
# Create a data.frame with dirty names
test_df <- as.data.frame(matrix(ncol = 6))
names(test_df) <- c("firstName", "ábc@!*", "% successful (2009)",
  "REPEAT VALUE", "REPEAT VALUE", "")
test_df
## firstName ábc@!* % successful (2009) REPEAT VALUE REPEAT VALUE
## 1 NA NA NA NA NA NA## first_name abc percent_successful_2009 repeat_value repeat_value_2 x
## 1 NA NA NA NA NA NAAutomatische Tabellen mit gtsummary
Automatische Tabellen mit gtsummary
library(gtsummary)
options(
  gtsummary.add_p.test.continuous_by2 = "t.test",
  gtsummary.add_p.test.continuous = "aov"
)
d <- diamonds
sum_tbl <- d %>%
  select(price, cut, carat) %>%
  mutate(cut = factor(cut, ordered = F)) %>%
  filter(cut %in% c("Premium", "Fair", "Good")) %>%
  droplevels() %>%
  tbl_summary(by = cut,
    statistic = list(all_continuous() ~ "{mean} ({sd})"),
    label = list(carat ~ "Carat",
      price ~ "Price")) %>%
  add_p()
Automatische Tabellen
| Characteristic | Fair, N = 16101 | Good, N = 49061 | Premium, N = 137911 | p-value2 |
|---|---|---|---|---|
| Price | 4359 (3560) | 3929 (3682) | 4584 (4349) | <0.001 |
| Carat | 1.05 (0.52) | 0.85 (0.45) | 0.89 (0.52) | <0.001 |
|
1
Statistics presented: mean (SD)
2
Statistical tests performed: One-way ANOVA
|
||||
correlation-Paket
## Parameter1 | Parameter2 |     r |         95% CI |      t |    df |      p |  Method | n_Obs
## --------------------------------------------------------------------------------------------
## price      |      carat |  0.92 | [ 0.92,  0.92] | 551.41 | 53938 | < .001 | Pearson | 53940
## price      |      depth | -0.01 | [-0.02,  0.00] |  -2.47 | 53938 | 0.013  | Pearson | 53940
## carat      |      depth |  0.03 | [ 0.02,  0.04] |   6.56 | 53938 | < .001 | Pearson | 53940
Automatische Berichte
report-Paket
Hier zu finden: https://github.com/easystats/report
Dataframes
## # Descriptive Statistics
##
## Characteristic     |         Summary
## ------------------------------------
## Mean price (SD)    | 3932.8 (3989.4)
## Mean carat (SD)    |       0.8 (0.5)
## cut [Fair], %      |             3.0
## cut [Good], %      |             9.1
## cut [Very Good], % |            22.4
## cut [Premium], %   |            25.6
## cut [Ideal], % | 40.0## # Descriptive Statistics
##
## Characteristic | Fair (n=1610) | Good (n=4906) | Very Good (n=12082) | Premium (n=13791) | Ideal (n=21551) | Total
## ---------------------------------------------------------------------------------------------------------------------------------
## Mean price (SD) | 4358.8 (3560.4) | 3928.9 (3681.6) | 3981.8 (3935.9) | 4584.3 (4349.2) | 3457.5 (3808.4) | 3932.8 (3989.4)
## Mean carat (SD) | 1.0 (0.5) | 0.8 (0.5) | 0.8 (0.5) | 0.9 (0.5) | 0.7 (0.4) | 0.8 (0.5)t-Test
d %>%
  filter(cut == "Fair" | cut == "Ideal") %>%
  droplevels() %>%
  t.test(carat ~ cut, data = .) %>%
  report()
The Welch Two Sample t-test suggests that the difference of carat by cut (mean in group Fair = 1.05, mean in group Ideal = 0.70) is significant (difference = 0.34, 95% CI [0.32, 0.37], t(1781.99) = 26.00, p < .001) and can be considered as very large (Cohen’s d = 1)., The Welch Two Sample t-test suggests that the difference of carat by cut (mean in group Fair = 1.05, mean in group Ideal = 0.70) is significant (difference = 0.34, 95% CI [0.32, 0.37], t(1781.99) = 26.00, p < .001) and can be considered as very large (Cohen’s d = 1)., The Welch Two Sample t-test suggests that the difference of carat by cut (mean in group Fair = 1.05, mean in group Ideal = 0.70) is significant (difference = 0.34, 95% CI [0.32, 0.37], t(1781.99) = 26.00, p < .001) and can be considered as very large (Cohen’s d = 1). and The Welch Two Sample t-test suggests that the difference of carat by cut (mean in group Fair = 1.05, mean in group Ideal = 0.70) is significant (difference = 0.34, 95% CI [0.32, 0.37], t(1781.99) = 26.00, p < .001) and can be considered as very large (Cohen’s d = 1).
ANOVA (base)
The ANOVA suggests that:
- The main effect of color is significant (F(6, 53905) = 294.07, p < .001) and can be considered as small (partial omega squared = 0.03).
- The main effect of cut is significant (F(4, 53905) = 159.36, p < .001) and can be considered as small (partial omega squared = 0.01).
- The interaction between color and cut is significant (F(24, 53905) = 4.53, p < .001) and can be considered as very small (partial omega squared = 0.00).
ANOVA (afex)
library(afex)
d$id <- 1:length(d$carat)
afexaov <- aov_ez("id", dv = "price", between = c("color", "cut"), data = d)
afexaov$aov %>%
  report()
The ANOVA suggests that:
- The main effect of color is significant (F(6, 53905) = 294.07, p < .001) and can be considered as small (partial omega squared = 0.03).
- The main effect of cut is significant (F(4, 53905) = 159.36, p < .001) and can be considered as small (partial omega squared = 0.01).
- The interaction between color and cut is significant (F(24, 53905) = 4.53, p < .001) and can be considered as very small (partial omega squared = 0.00).
## Parameter | Sum_Squares |    df | Mean_Square |      F |    p | Omega_Sq_partial
## --------------------------------------------------------------------------------
## color     | 2.68491e+10 |     6 | 4.47485e+09 | 294.07 | 0.00 |             0.03
## cut       | 9.69968e+09 |     4 | 2.42492e+09 | 159.36 | 0.00 |             0.01
## color:cut | 1.65346e+09 |    24 | 6.88940e+07 |   4.53 | 0.00 |             0.00
## Residuals | 8.20271e+11 | 53905 | 1.52170e+07 |        |      |
LMM
d %>%
  filter(cut == "Fair" | cut == "Ideal") %>%
  droplevels() %>%
  lmer(price ~ carat + cut + (1 | carat), data = .) %>%
  report()
We fitted a linear mixed model (estimated using REML and nloptwrap optimizer) to predict price with carat and cut (formula = price ~ carat + cut). The model included carat as random effects (formula = ~1 | carat). Standardized parameters were obtained by fitting the model on a standardized version of the dataset. Effect sizes were labelled following Funder’s (2019) recommendations.The model’s total explanatory power is substantial (conditional R2 = 0.87) and the part related to the fixed effects alone (marginal R2) is of 0.57. The model’s intercept, corresponding to price = 0, carat = 0 and cut = Fair, is at -1192.60 (SE = 273.06, 95% CI [-1727.79, -657.41], p < .001). Within this model:
- The effect of carat is positive and can be considered as very large and significant (beta = 6346.99, SE = 165.26, 95% CI [6023.09, 6670.89], std. beta = 1.67, p < .001).
- The effect of cut.L is positive and can be considered as small and significant (beta = 1129.24, SE = 26.68, 95% CI [1076.95, 1181.54], std. beta = 0.30, p < .001).
Daten untersuchen
Datenblatt diagonstizieren
## # A tibble: 11 x 6
##    variables types   missing_count missing_percent unique_count unique_rate
##    <chr>     <chr>           <int>           <dbl>        <int>       <dbl>
##  1 carat     numeric             0               0          273   0.00506
##  2 cut       ordered             0               0            5   0.0000927
##  3 color     ordered             0               0            7   0.000130
##  4 clarity   ordered             0               0            8   0.000148
##  5 depth     numeric             0               0          184   0.00341
##  6 table     numeric             0               0          127   0.00235
##  7 price     integer             0               0        11602   0.215
##  8 x         numeric             0               0          554   0.0103
##  9 y         numeric             0               0          552   0.0102
## 10 z         numeric             0               0          375   0.00695
## 11 id integer 0 0 53940 1## # A tibble: 8 x 10
## variables min Q1 mean median Q3 max zero minus outlier
## <chr> <dbl> <dbl> <dbl> <dbl> <dbl> <dbl> <int> <int> <int>
## 1 carat 0.2 0.4 0.798 7.00e-1 1.04e0 5.01e0 0 0 1889
## 2 depth 43 61 61.7 6.18e+1 6.25e1 7.90e1 0 0 2545
## 3 table 43 56 57.5 5.70e+1 5.90e1 9.50e1 0 0 605
## 4 price 326 950 3933. 2.40e+3 5.32e3 1.88e4 0 0 3538
## 5 x 0 4.71 5.73 5.70e+0 6.54e0 1.07e1 8 0 32
## 6 y 0 4.72 5.73 5.71e+0 6.54e0 5.89e1 7 0 29
## 7 z 0 2.91 3.54 3.53e+0 4.04e0 3.18e1 20 0 49
## 8 id 1 13486. 26970. 2.70e+4 4.05e4 5.39e4 0 0 0## # A tibble: 20 x 6
## variables levels N freq ratio rank
## <chr> <ord> <int> <int> <dbl> <int>
## 1 cut Ideal 53940 21551 40.0 1
## 2 cut Premium 53940 13791 25.6 2
## 3 cut Very Good 53940 12082 22.4 3
## 4 cut Good 53940 4906 9.10 4
## 5 cut Fair 53940 1610 2.98 5
## 6 color G 53940 11292 20.9 1
## 7 color E 53940 9797 18.2 2
## 8 color F 53940 9542 17.7 3
## 9 color H 53940 8304 15.4 4
## 10 color D 53940 6775 12.6 5
## 11 color I 53940 5422 10.1 6
## 12 color J 53940 2808 5.21 7
## 13 clarity SI1 53940 13065 24.2 1
## 14 clarity VS2 53940 12258 22.7 2
## 15 clarity SI2 53940 9194 17.0 3
## 16 clarity VS1 53940 8171 15.1 4
## 17 clarity VVS2 53940 5066 9.39 5
## 18 clarity VVS1 53940 3655 6.78 6
## 19 clarity IF 53940 1790 3.32 7
## 20 clarity I1 53940 741 1.37 8## variables outliers_cnt outliers_ratio outliers_mean with_mean without_mean
## 1 carat 1889 3.502039 2.1537 0.79794 0.74874
## 2 depth 2545 4.718205 61.2048 61.74940 61.77637
## 3 table 605 1.121617 64.8430 57.45718 57.37340
## 4 price 3538 6.559140 14944.7764 3932.79972 3159.80711
## 5 x 32 0.059325 7.2394 5.73116 5.73026
## 6 y 29 0.053763 9.7734 5.73453 5.73235
## 7 z 49 0.090842 4.0547 3.53873 3.53826
## 8 id 0 0.000000 NaN 26970.50000 26970.50000Normalverteilung
## # A tibble: 14 x 5
##    variable color statistic  p_value sample
##    <chr>    <ord>     <dbl>    <dbl>  <dbl>
##  1 price    D         0.741 1.48e-66   5000
##  2 price    E         0.726 1.09e-67   5000
##  3 price    F         0.787 8.07e-63   5000
##  4 price    G         0.803 2.84e-61   5000
##  5 price    H         0.846 8.64e-57   5000
##  6 price    I         0.854 9.30e-56   5000
##  7 price    J         0.889 6.11e-41   2808
##  8 carat    D         0.873 2.94e-53   5000
##  9 carat    E         0.878 1.17e-52   5000
## 10 carat    F         0.909 1.36e-47   5000
## 11 carat    G         0.896 7.92e-50   5000
## 12 carat    H         0.926 2.31e-44   5000
## 13 carat    I         0.935 3.96e-42   5000
## 14 carat    J         0.955 1.64e-28   2808
Deskriptive Statistik
# tidy alternative for psych::describe
d %>%
  describe() %>%
  select(-starts_with("p")) # don't show percentiles
## # A tibble: 8 x 9
## variable n na mean sd se_mean IQR skewness kurtosis
## <chr> <int> <int> <dbl> <dbl> <dbl> <dbl> <dbl> <dbl>
## 1 carat 53940 0 5.73 1.12 0.00483 1.83 0.379 -0.618
## 2 depth 53940 0 5.73 1.12 0.00483 1.83 0.379 -0.618
## 3 table 53940 0 5.73 1.12 0.00483 1.83 0.379 -0.618
## 4 price 53940 0 5.73 1.12 0.00483 1.83 0.379 -0.618
## 5 x 53940 0 5.73 1.12 0.00483 1.83 0.379 -0.618
## 6 y 53940 0 5.73 1.12 0.00483 1.83 0.379 -0.618
## 7 z 53940 0 5.73 1.12 0.00483 1.83 0.379 -0.618
## 8 id 53940 0 5.73 1.12 0.00483 1.83 0.379 -0.618# tidy alternative for psych::describeBy
d %>%
group_by(cut) %>%
describe(price, carat) %>%
select(-starts_with("p")) # don't show percentiles## # A tibble: 10 x 10
## variable cut n na mean sd se_mean IQR skewness kurtosis
## <chr> <ord> <dbl> <dbl> <dbl> <dbl> <dbl> <dbl> <dbl> <dbl>
## 1 price Fair 1610 0 4.36e+3 3.56e+3 8.87e+1 3155. 1.78 3.09
## 2 price Good 4906 0 3.93e+3 3.68e+3 5.26e+1 3883 1.72 3.05
## 3 price Very … 12082 0 3.98e+3 3.94e+3 3.58e+1 4461. 1.60 2.24
## 4 price Premi… 13791 0 4.58e+3 4.35e+3 3.70e+1 5250 1.33 1.07
## 5 price Ideal 21551 0 3.46e+3 3.81e+3 2.59e+1 3800. 1.84 2.98
## 6 carat Fair 1610 0 1.05e+0 5.16e-1 1.29e-2 0.5 1.69 5.34
## 7 carat Good 4906 0 8.49e-1 4.54e-1 6.48e-3 0.51 1.03 1.23
## 8 carat Very … 12082 0 8.06e-1 4.59e-1 4.18e-3 0.61 0.994 0.896
## 9 carat Premi… 13791 0 8.92e-1 5.15e-1 4.39e-3 0.79 0.862 0.431
## 10 carat Ideal 21551 0 7.03e-1 4.33e-1 2.95e-3 0.66 1.34 1.63Bildverarbeitung (und -bearbeitung) in R
Popularity Contest
fin

Anhang: Die wichtigsten Funktionen
Allgemein
Hier geklaut: http://www.sr.bham.ac.uk/~ajrs/R/r-function_list.html
builtins() # List all built-in functions
options()  # Set options to control how R computes & displays results

?NA        # Help page on handling of missing data values
abs(x)     # The absolute value of "x"
append()   # Add elements to a vector
c(x)       # A generic function which combines its arguments
cat(x)     # Prints the arguments
cbind()    # Combine vectors by row/column (cf. "paste" in Unix)
diff(x)    # Returns suitably lagged and iterated differences
gl()       # Generate factors with the pattern of their levels
grep()     # Pattern matching
identical()  # Test if 2 objects are *exactly* equal
jitter()     # Add a small amount of noise to a numeric vector
julian()     # Return Julian date
length(x)    # Return no. of elements in vector x
ls()         # List objects in current environment
mat.or.vec() # Create a matrix or vector
paste(x)     # Concatenate vectors after converting to character
range(x)     # Returns the minimum and maximum of x
rep(1,5)     # Repeat the number 1 five times
rev(x)       # List the elements of "x" in reverse order
seq(1,10,0.4)  # Generate a sequence (1 -> 10, spaced by 0.4)
sequence()     # Create a vector of sequences
sign(x)        # Returns the signs of the elements of x
sort(x)        # Sort the vector x
order(x)       # list sorted element numbers of x
tolower(),toupper()  # Convert string to lower/upper case letters
unique(x)      # Remove duplicate entries from vector
system("cmd")  # Execute "cmd" in operating system (outside of R)
vector()       # Produces a vector of given length and mode

formatC(x)     # Format x using 'C' style formatting specifications
floor(x), ceiling(x), round(x), signif(x), trunc(x)   # rounding functions

Sys.getenv(x)  # Get the value of the environment variable "x"
Sys.putenv(x)  # Set the value of the environment variable "x"
Sys.time()     # Return system time
Sys.Date()     # Return system date
getwd()        # Return working directory
setwd()        # Set working directory
?files         # Help on low-level interface to file system
list.files()   # List files in a give directory
file.info()    # Get information about files

# Built-in constants:
pi,letters,LETTERS   # Pi, lower & uppercase letters, e.g. letters[7] = "g"
month.abb,month.name # Abbreviated & full names for months
Mathe
Hier geklaut: http://www.sr.bham.ac.uk/~ajrs/R/r-function_list.html
log(x),logb(),log10(),log2(),exp(),expm1(),log1p(),sqrt()   # Fairly obvious
cos(),sin(),tan(),acos(),asin(),atan(),atan2()       # Usual stuff
cosh(),sinh(),tanh(),acosh(),asinh(),atanh()         # Hyperbolic functions
union(),intersect(),setdiff(),setequal()             # Set operations
+,-,*,/,^,%%,%/%                                     # Arithmetic operators
<,>,<=,>=,==,!=                                      # Comparison operators
eigen()      # Computes eigenvalues and eigenvectors

deriv()      # Symbolic and algorithmic derivatives of simple expressions
integrate()  # Adaptive quadrature over a finite or infinite interval.

sqrt(),sum()
?Control     # Help on control flow statements (e.g. if, for, while)
?Extract     # Help on operators acting to extract or replace subsets of vectors
?Logic       # Help on logical operators
?Mod         # Help on functions which support complex arithmetic in R
?Paren       # Help on parentheses
?regex       # Help on regular expressions used in R
?Syntax      # Help on R syntax and giving the precedence of operators
?Special     # Help on special functions related to beta and gamma functions
Statistik
Hier geklaut: http://www.sr.bham.ac.uk/~ajrs/R/r-function_list.html
help(package=stats)   # List all stats functions

?Chisquare            # Help on chi-squared distribution functions
?Poisson              # Help on Poisson distribution functions
help(package=survival) # Survival analysis

cor.test()            # Perform correlation test
cumsum(); cumprod(); cummin(); cummax()   # Cumuluative functions for vectors
density(x)            # Compute kernel density estimates
ks.test()             # Performs one or two sample Kolmogorov-Smirnov tests
loess(), lowess()     # Scatter plot smoothing
mad()                 # Calculate median absolute deviation
mean(x), weighted.mean(x), median(x), min(x), max(x), quantile(x)
rnorm(), runif()  # Generate random data with Gaussian/uniform distribution
splinefun()           # Perform spline interpolation
smooth.spline()       # Fits a cubic smoothing spline
sd()                  # Calculate standard deviation
summary(x)            # Returns a summary of x: mean, min, max etc.
t.test()              # Student's t-test
var()                 # Calculate variance
sample()              # Random samples & permutations
ecdf()                # Empirical Cumulative Distribution Function
qqplot()              # quantile-quantile plot