ggplot2
Warum Plots: Anscombes Quartett
Scheinbar gleiche Daten
Diese vier Bedingungen sehen auf den ersten Blick ziemlich gleich aus:
## # A tibble: 4 x 9
##   set   mean_x mean_y  sd_x  sd_y cor_xy intercept slope r_squared
##   <fct>  <dbl>  <dbl> <dbl> <dbl>  <dbl>     <dbl> <dbl>     <dbl>
## 1 A          9   7.50  3.32  2.03  0.816      3      0.5     0.667
## 2 B          9   7.50  3.32  2.03  0.816      3.00   0.5     0.666
## 3 C          9   7.5   3.32  2.03  0.816      3.00   0.5     0.666
## 4 D          9   7.50  3.32  2.03  0.817      3.00   0.5     0.667
Aber!

Beispiele
Beispiel 1
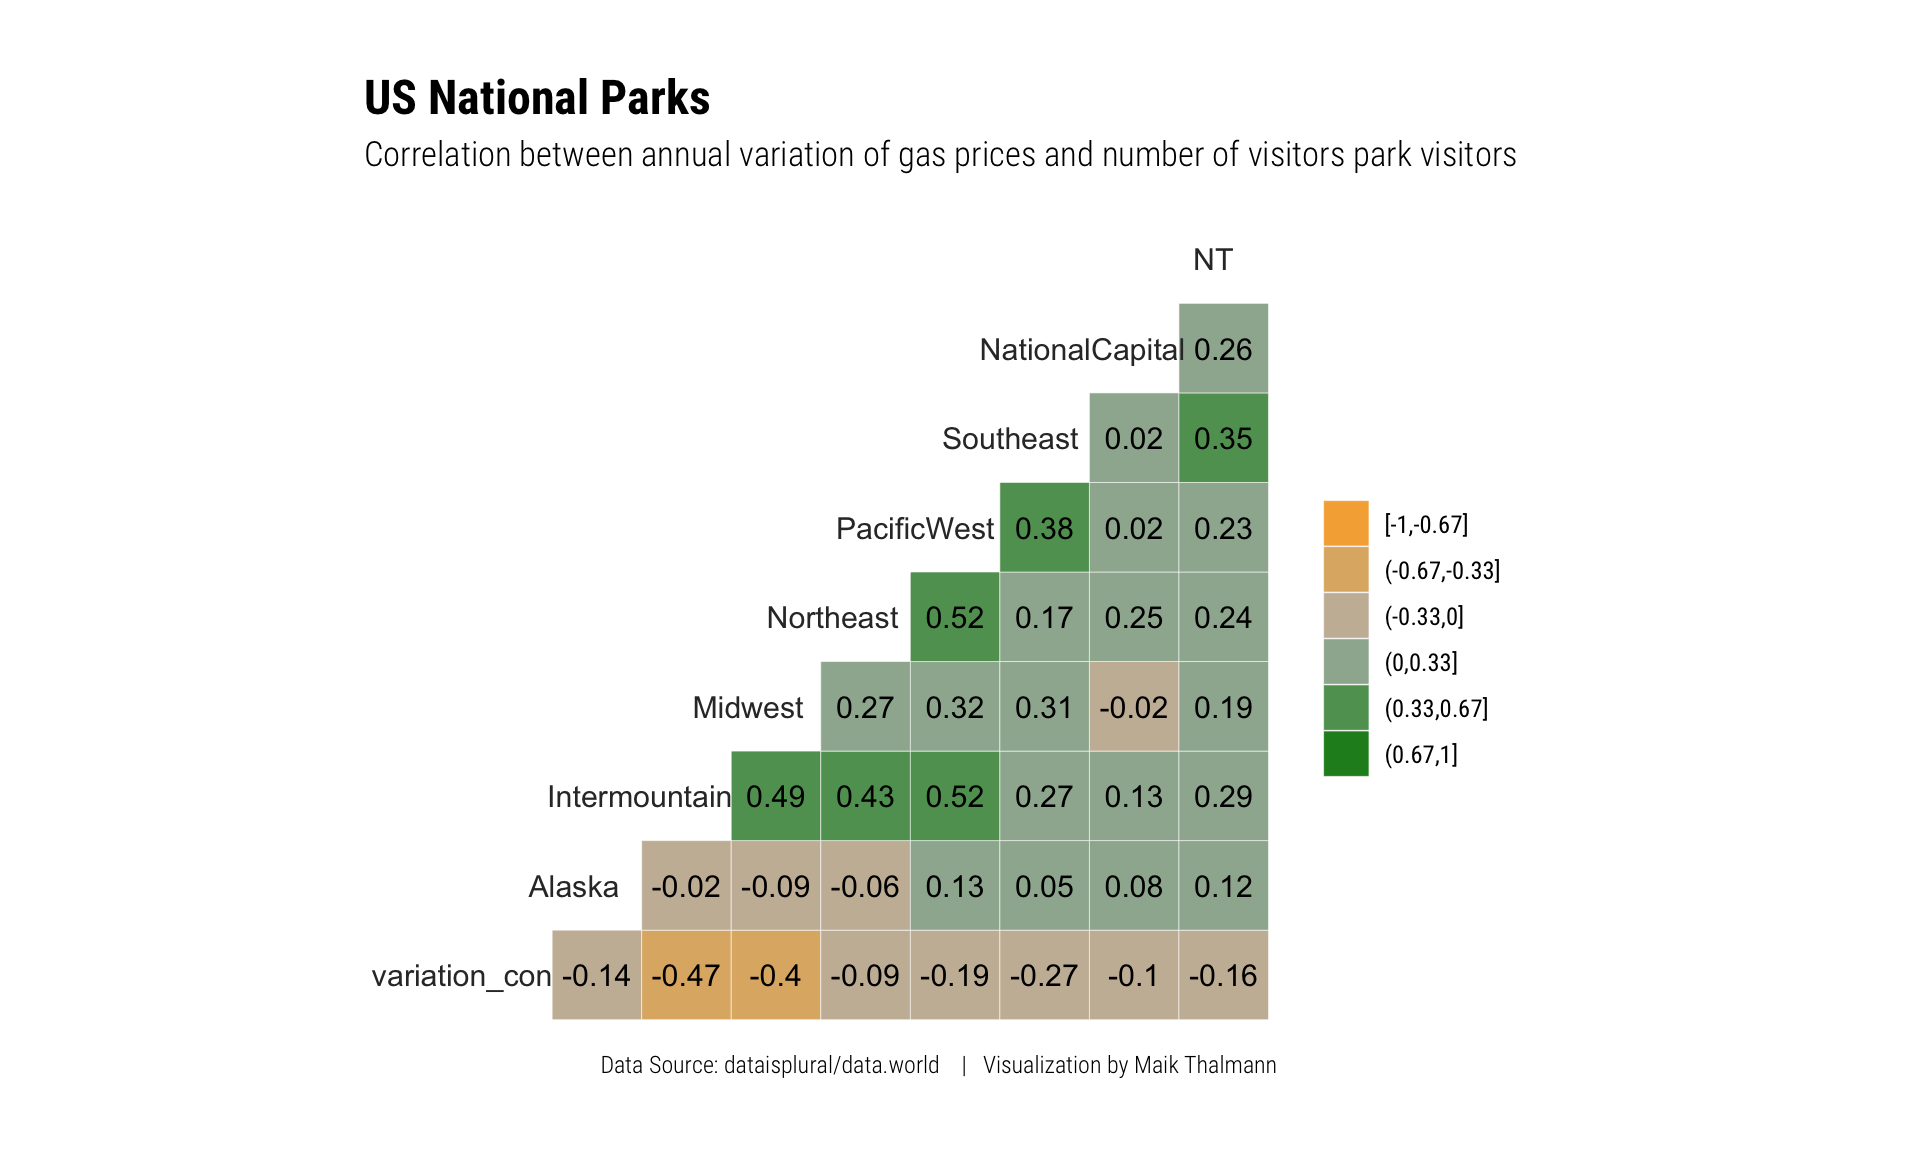
Beispiel 2
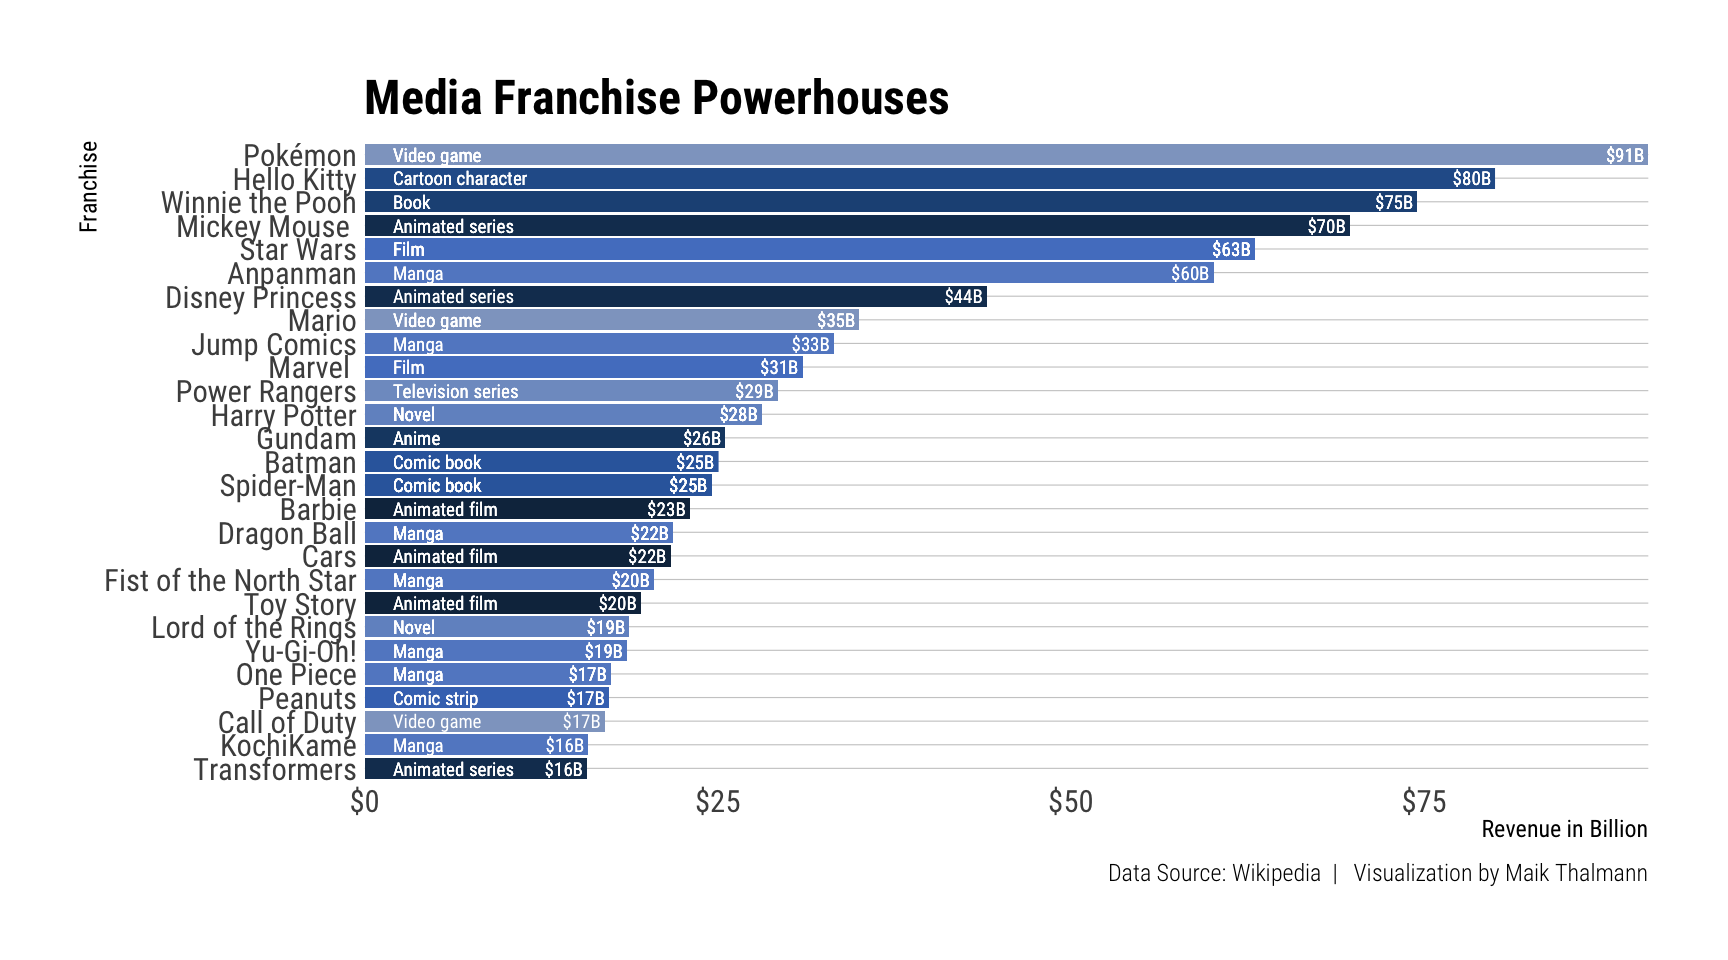
Beispiel 3
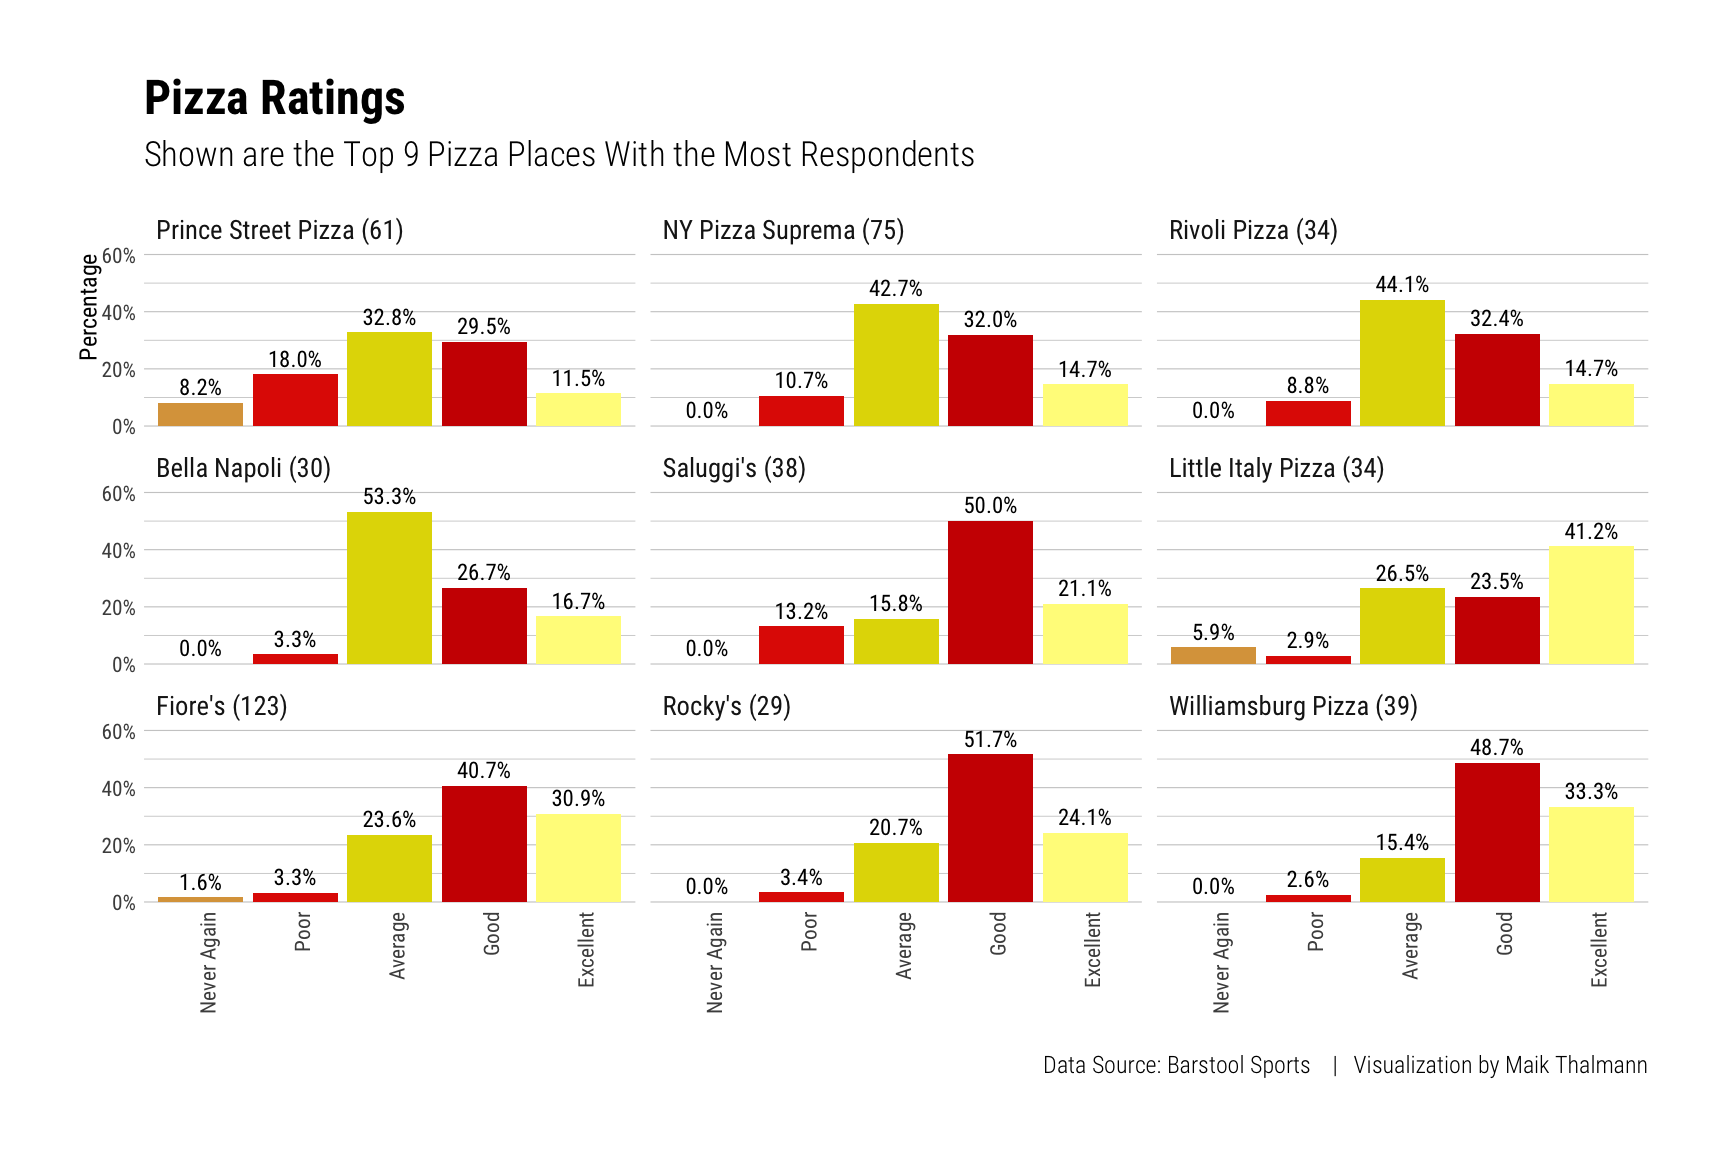
Einfache Plots
Daten für den Basisplot
Hier schonmal der Cheat Sheet zu ggplot2, eine weitere Hilfeseite und ein großartiges Tutorial.
Paket laden und Daten präparieren (ich verwende hier “nur” 5000 Beobachtungen, weil es sonst in manchen Plots ziemlich voll wird; das kommt aber ganz auf die Art des Plots an):
##       carat       cut color clarity depth table price    x    y    z
## 24388  0.41 Very Good     D     SI2  62.3    61   638 4.72 4.75 2.95
## 43307  0.50 Very Good     F     VS2  62.8    57  1402 5.05 5.08 3.18
## 4050   1.03      Fair     I     SI2  65.2    56  3530 6.42 6.35 4.16
## 11571  1.10     Ideal     I     SI1  62.1    57  5037 6.60 6.64 4.11
## 25173  1.51 Very Good     E     VS2  63.3    61 13757 7.24 7.17 4.56
## 32618  0.30     Ideal     H     VS2  62.1    55   457 4.30 4.33 2.68
Zu den Daten selbst: “A dataset containing the prices and other attributes of almost 54,000 diamonds.”
ggplot()
Grundgerüst ist der ggplot-Befehl mit Datensatz- und aes-Angaben: Werte auf der \(x\)- und \(y\)-Achse. Dabei sollte die abhängige Variable, hier der Verkaufspreis, die \(y\)-Achse bilden, während die (erste) unabhängige Variable, hier das Gewicht der Diamanten, auf der \(x\)-Achse verortet ist.
Ich speichere diese Angaben unter dem Namen p ab, damit ich später weniger Tipparbeit habe und euch einfach verschiedene Variationen desselben Plots zeigen kann. Nötig ist das aber nicht unbedingt.
Geometrien
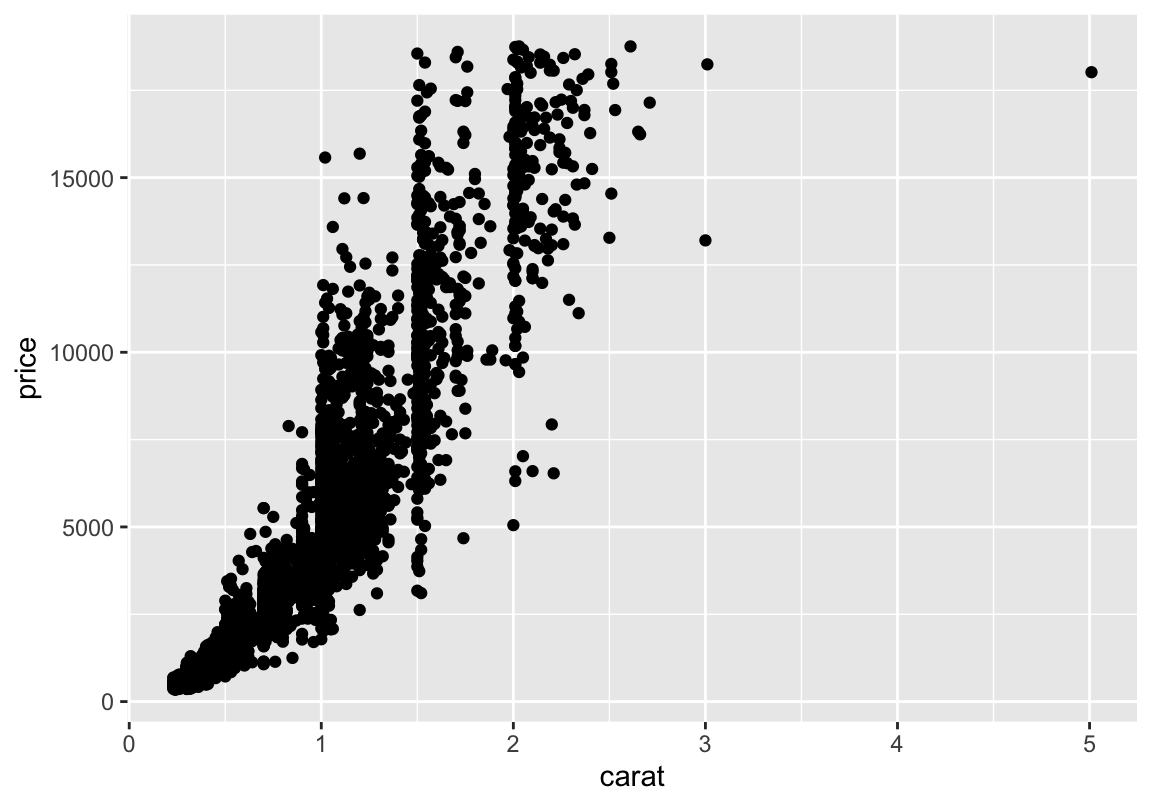
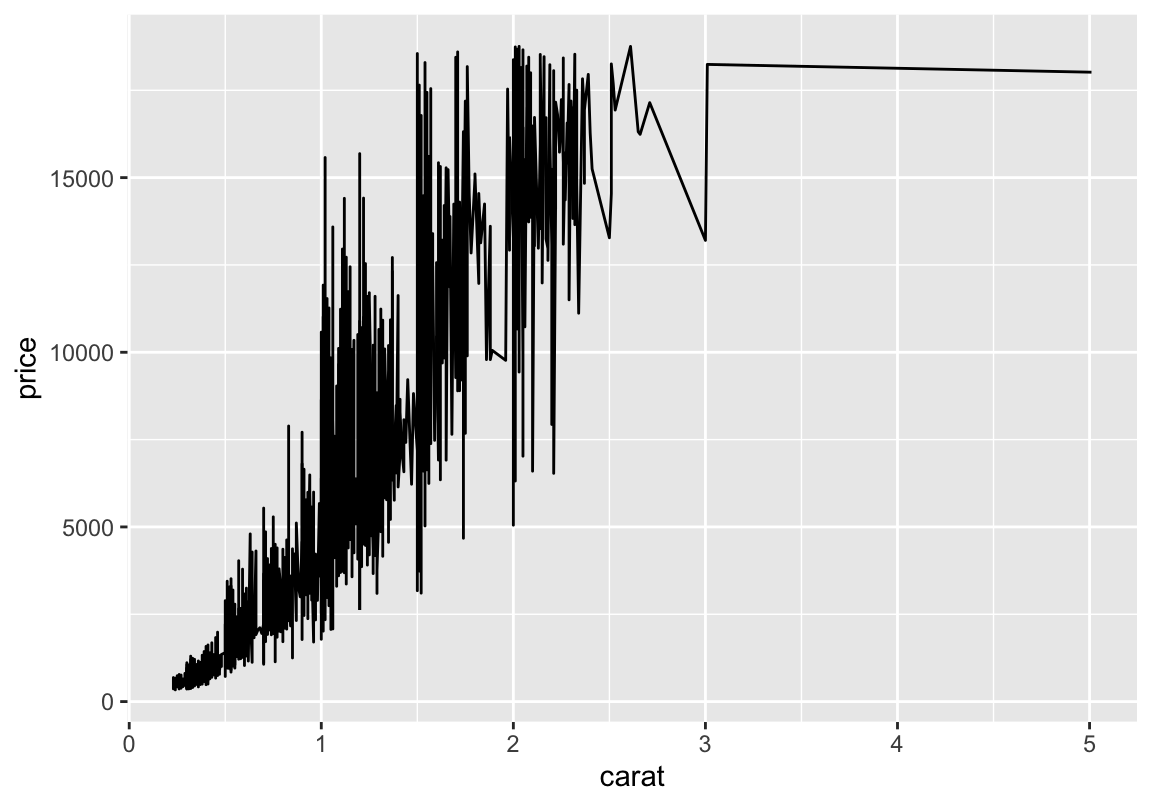
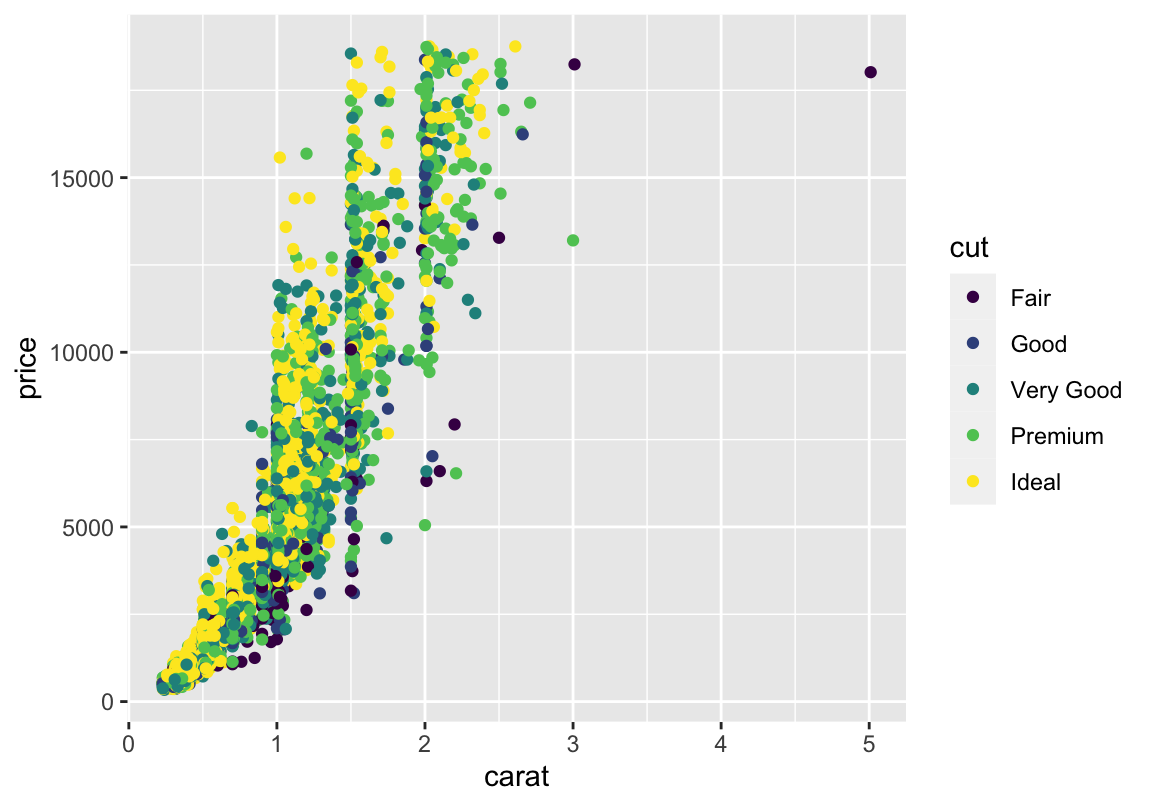
Das liegt daran, dass wir ggplot noch nicht gesagt haben, was für eine Art Plot wir haben wollen. Dies machen wir mithilfe sogenannter Geometrien, die wir einfach per + unserem Objekt hinzufügen können. Gängig sind vor allem Scatterplots (geom_point), Linienplots (geom_line) und Balkendiagramme (geom_bar/geom_histogramm)
Geometrien
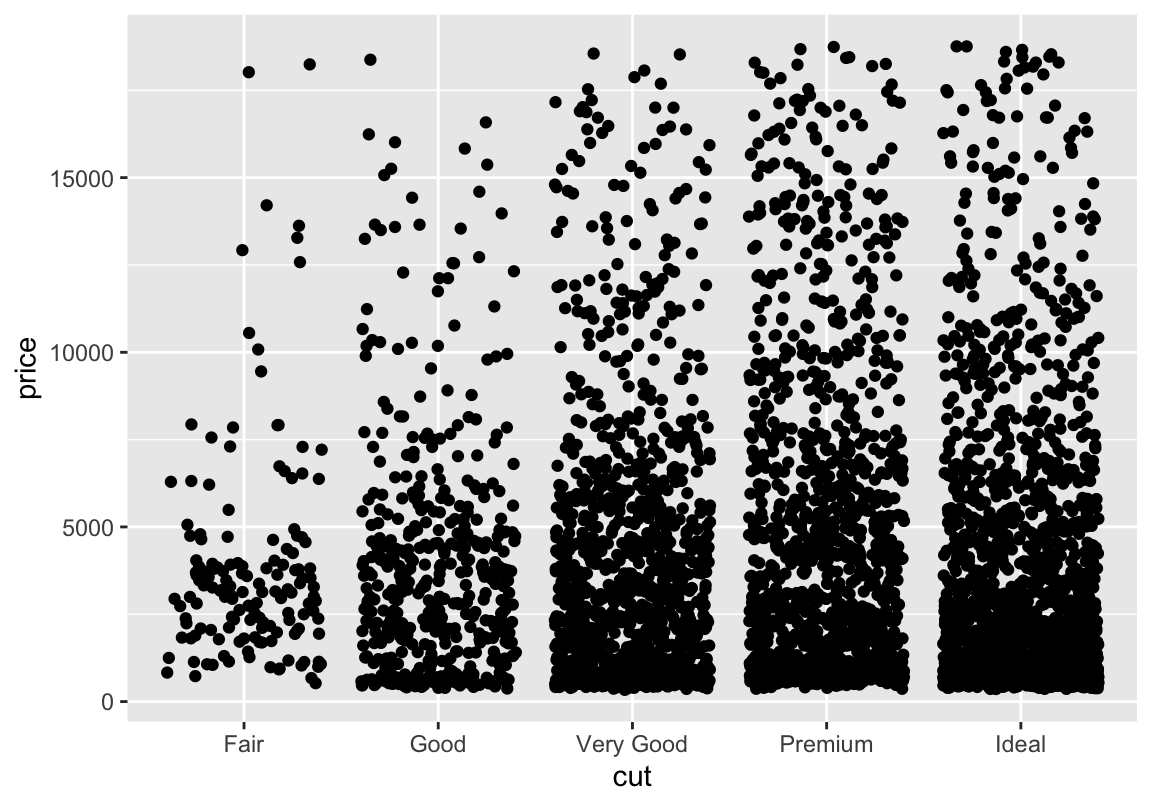
Falls sich Punkte überlagern: geom_jitter rüttelt ein wenig an den Punkten, damit sie sich nicht länger überschneiden
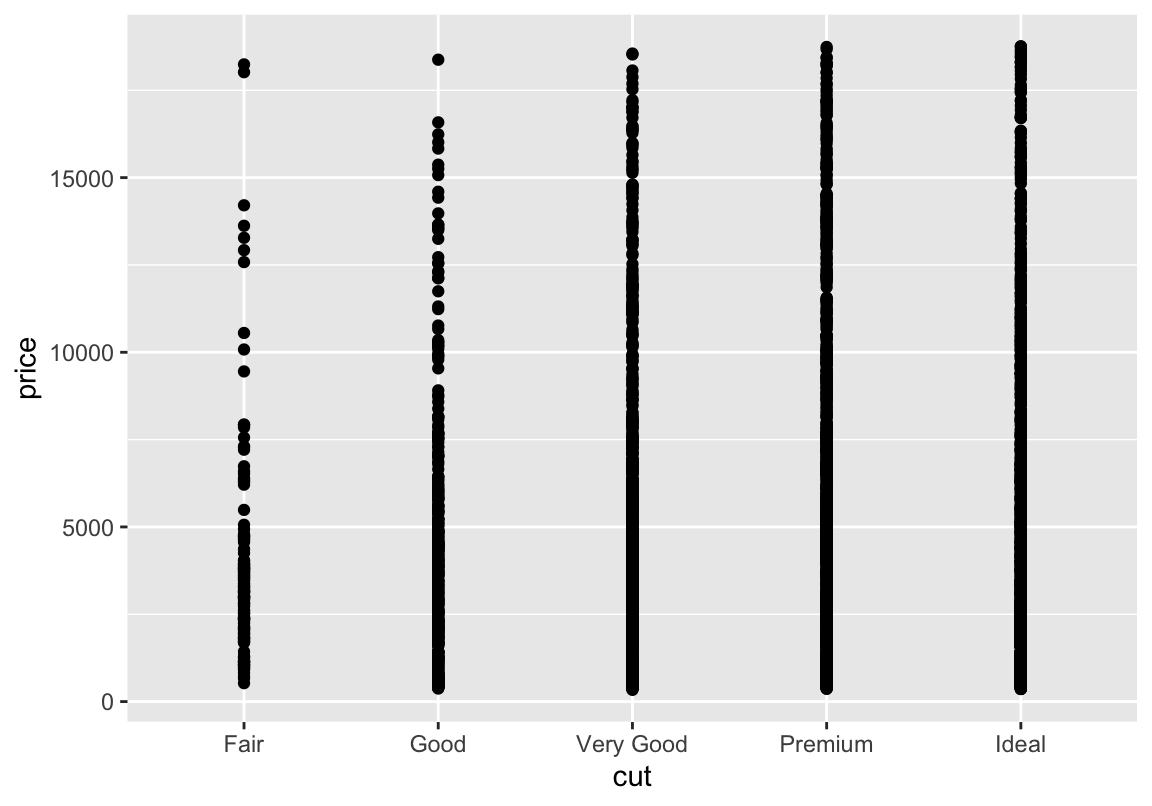
Geometrien
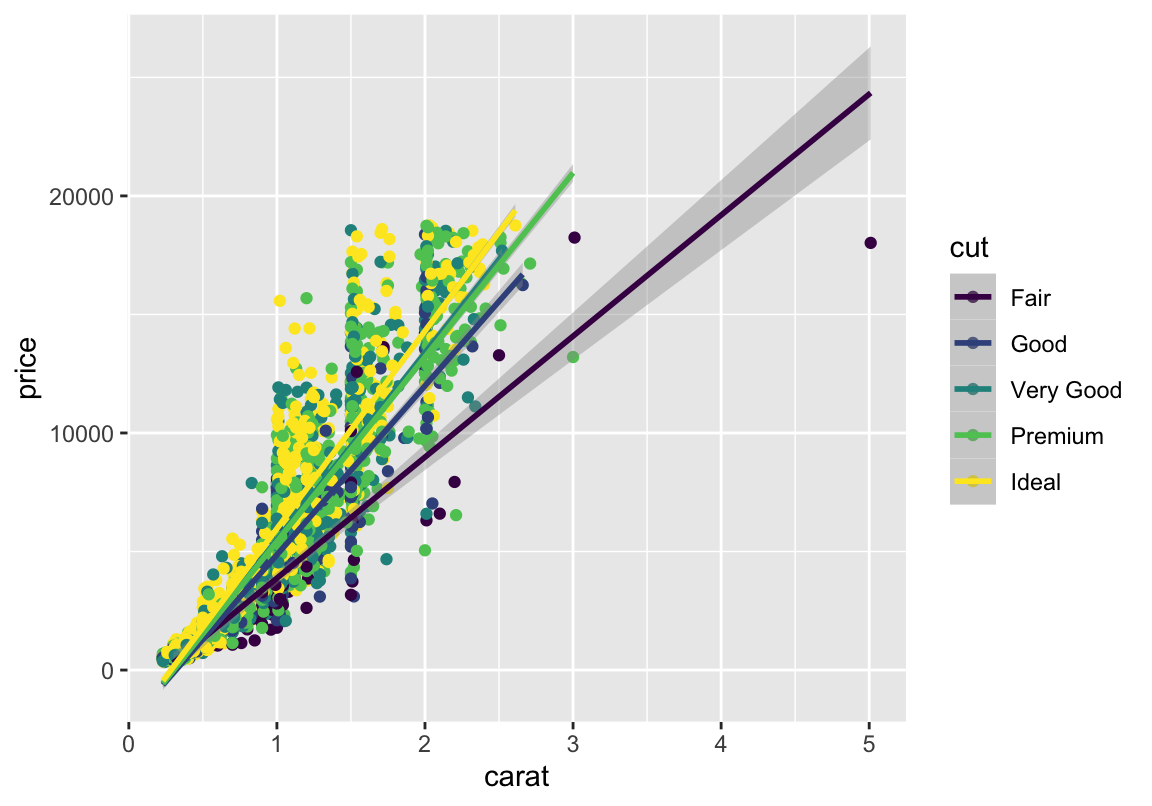
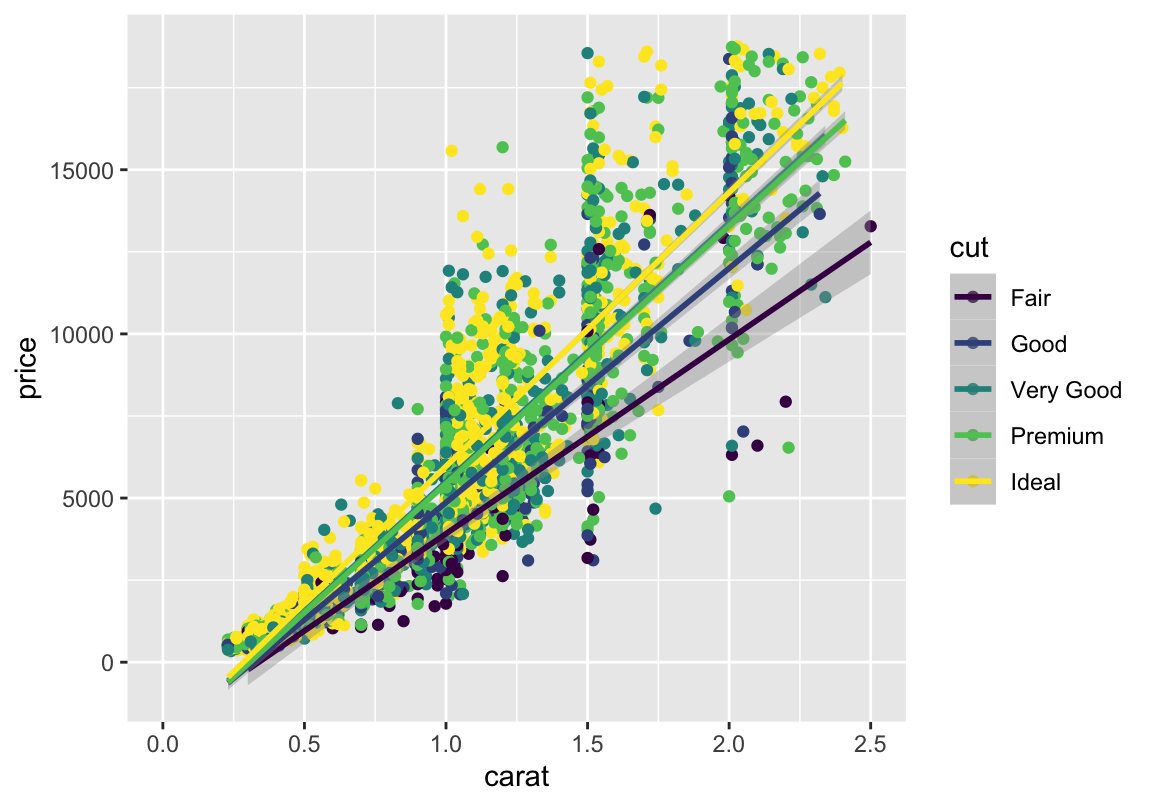
Hier eine Trendlinie (LM bzw Korrelation):
## `geom_smooth()` using formula 'y ~ x'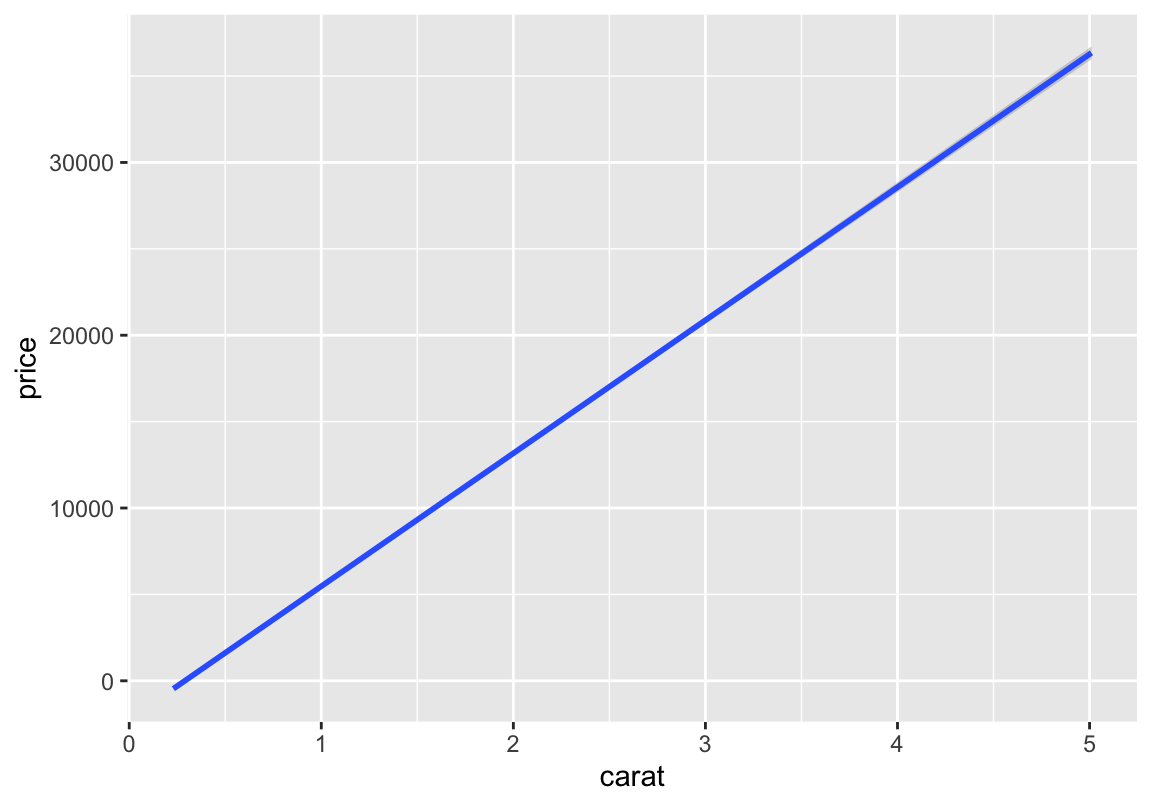
Geometrien
Linie + Punkte
## `geom_smooth()` using formula 'y ~ x'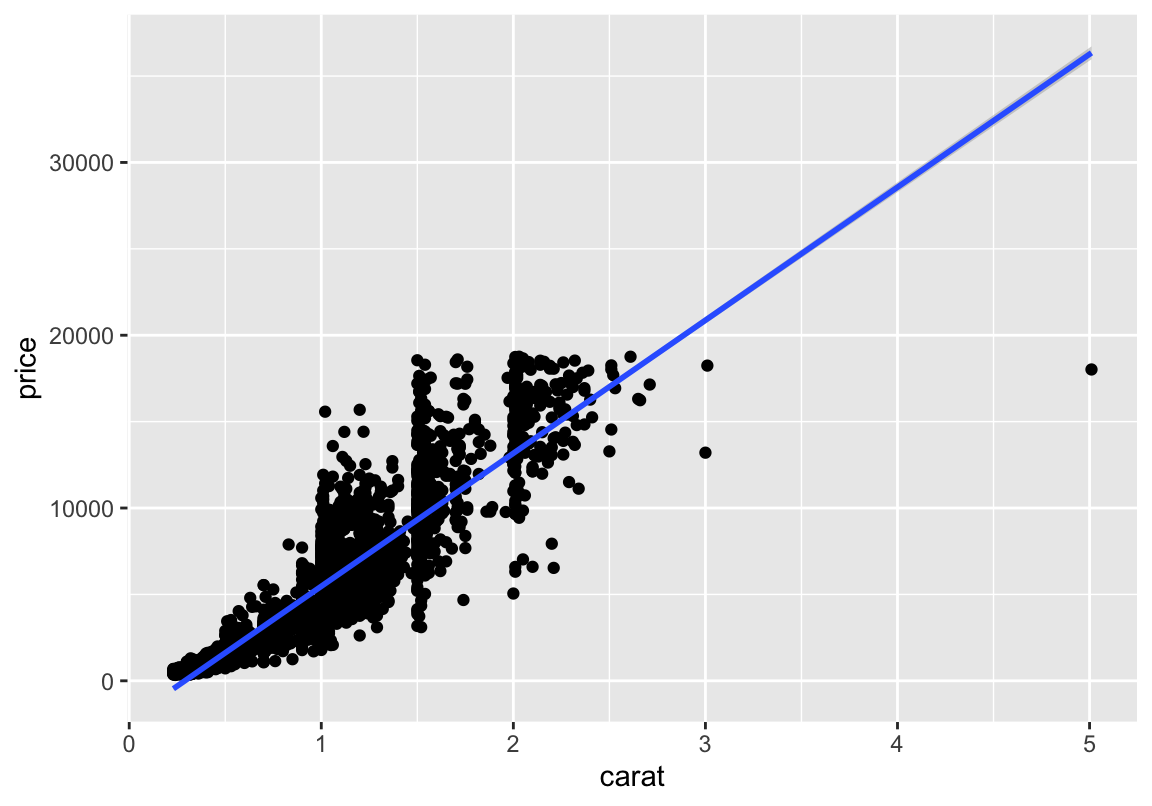
Mehr Spalten
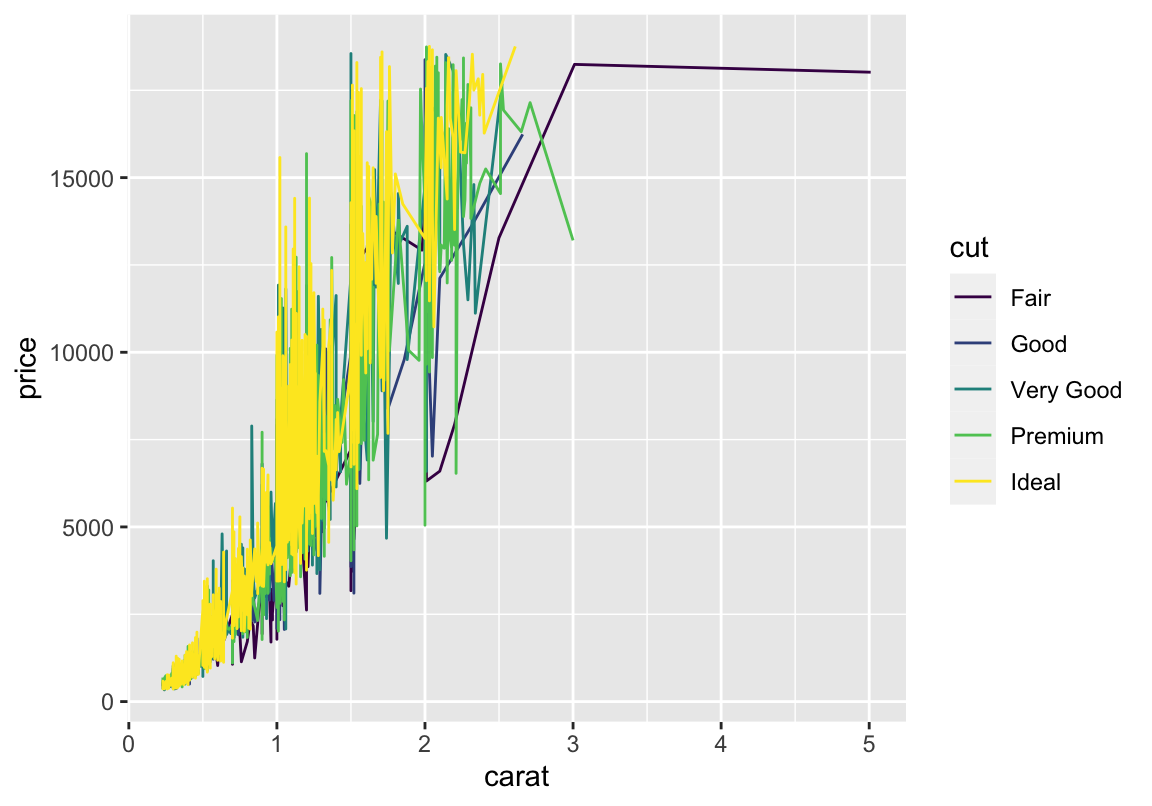
Was ist, wenn ihr mehr als nur zwei Spalten unterbringen will? \(\rightarrow\) aes erweitern.
Weitere Möglichkeiten:
- fill
- linetype (kurz: lty)
- size
- group
- alphaMehr Spalten
Was ist, wenn ihr mehr als nur zwei Spalten unterbringen will? \(\rightarrow\) aes erweitern:
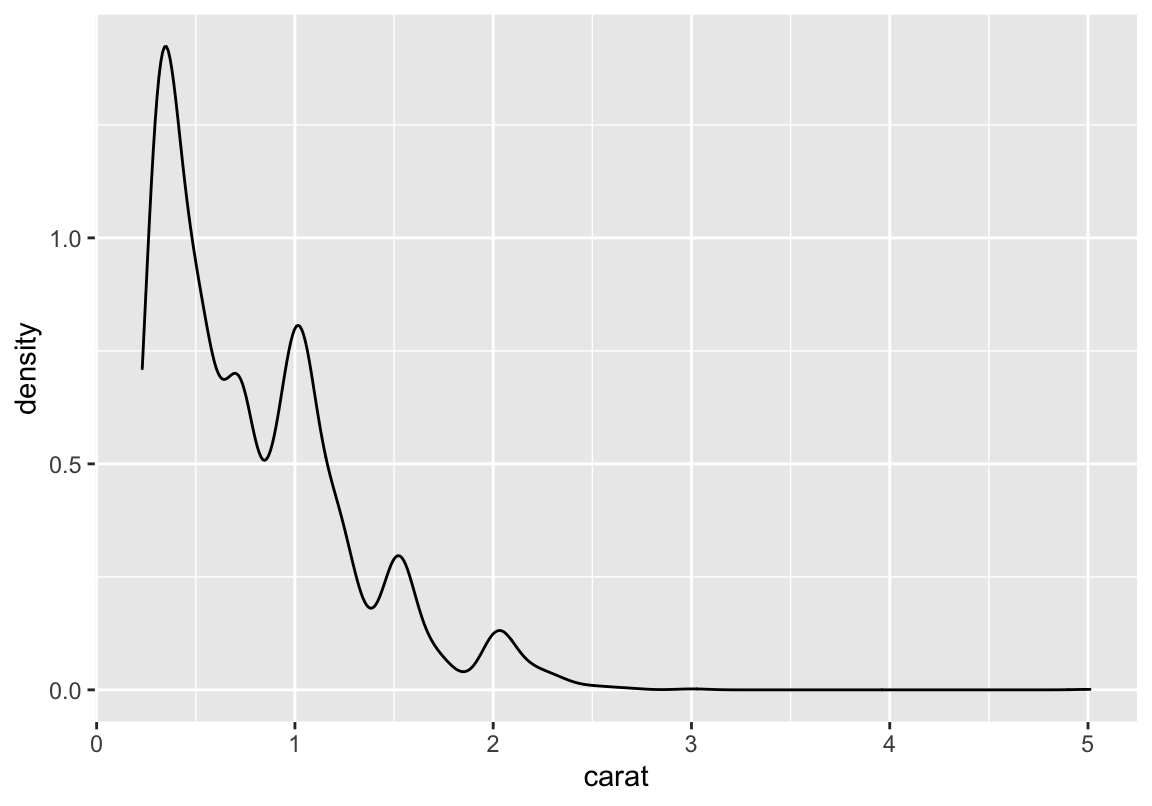
Häufigkeiten
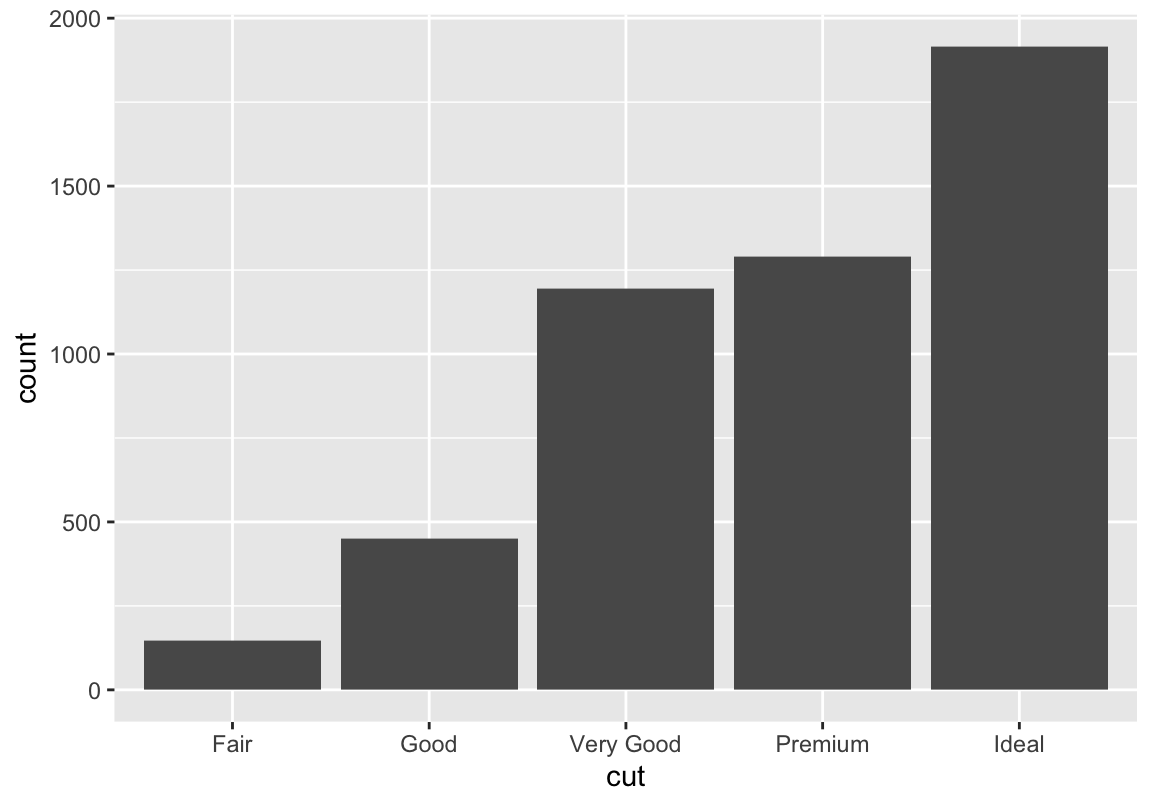
fill statt color weil wir nicht bloß die Umrandung der Balken einfärben wollen
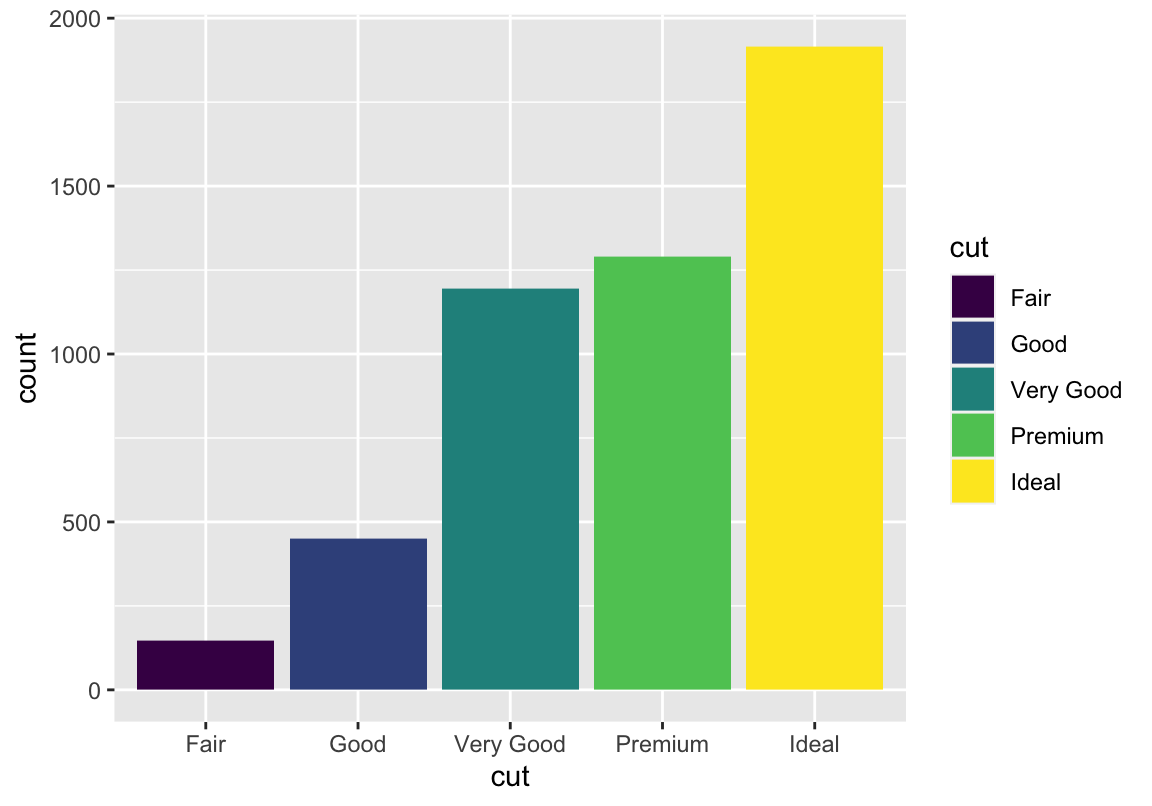
Häufigkeiten
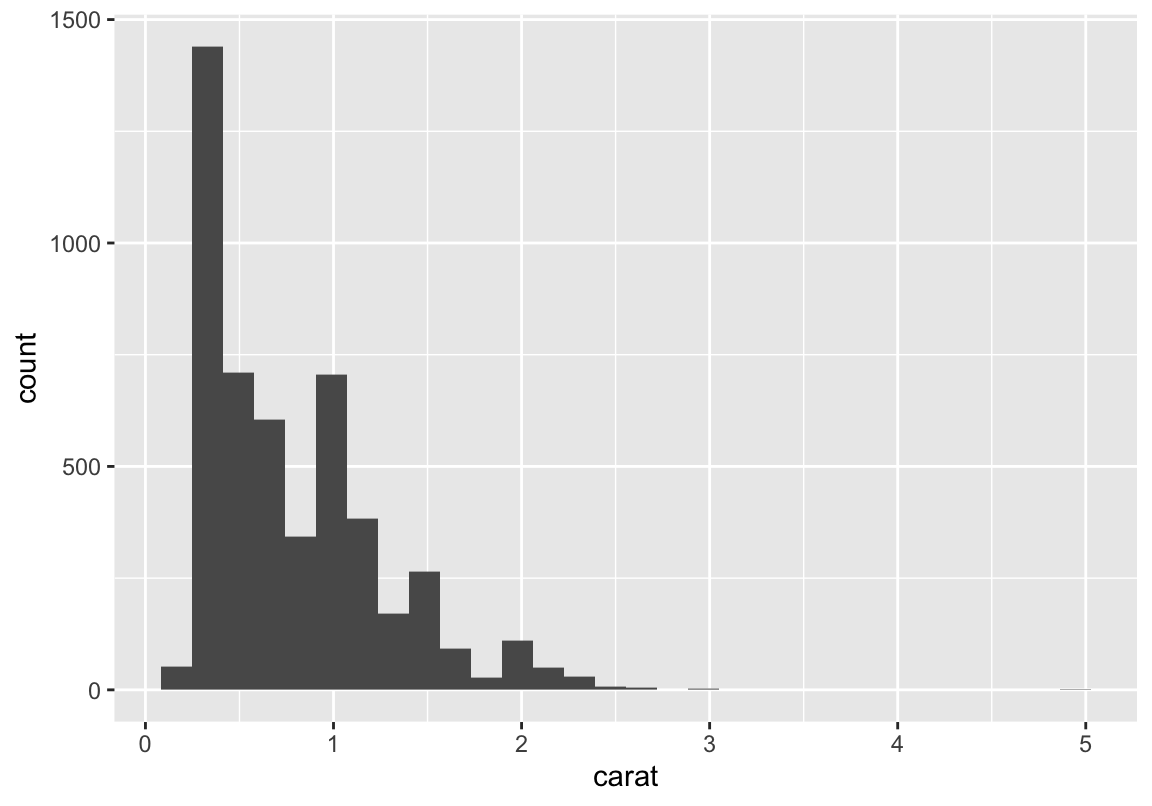
Zum Unterschied zwischen Histogrammen und Barplots: Ohne weitere Argumente sind Barplots für diskrete Daten und Histogramme für kontinuierliche Daten ausgelegt (ich zeige euch aber gleich, dass man es auch anders machen kann)
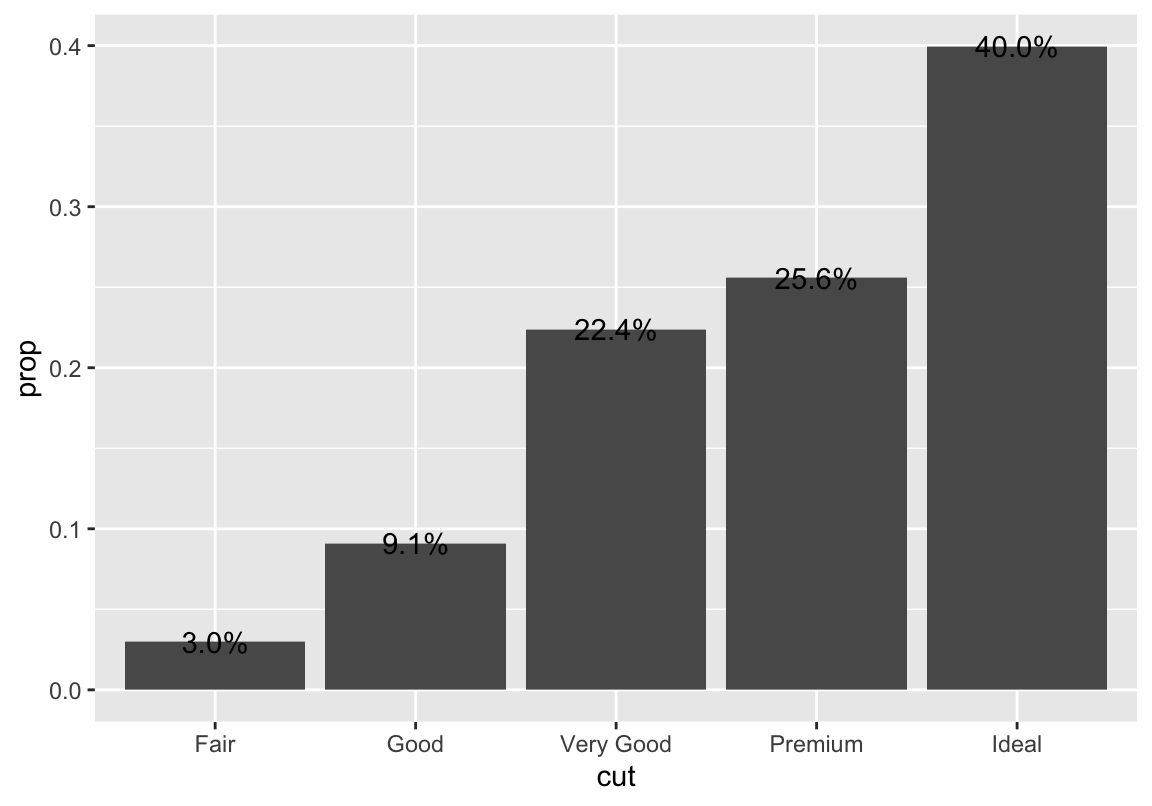
Prozente
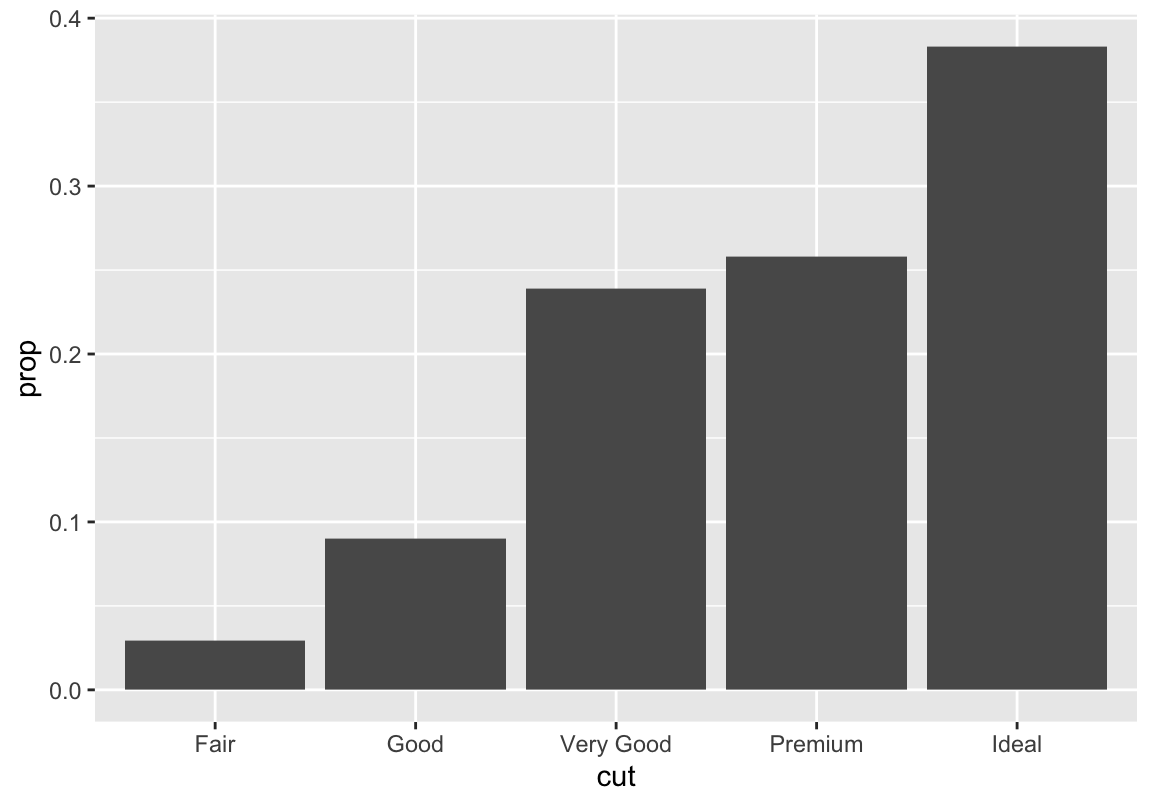
group = 1 damit Prozente nicht innerhalb der Schliffkategorien berechnet werden (dann hätten wir überall 100%!)
Plots erweitern
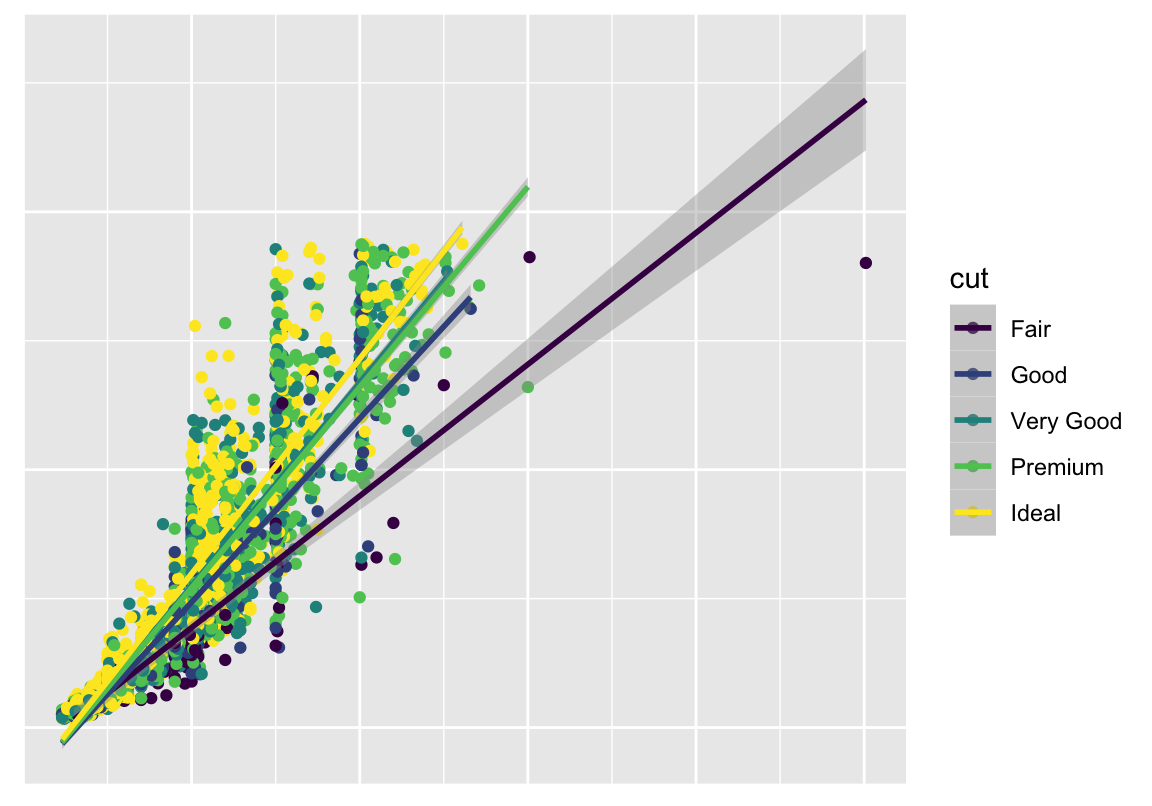
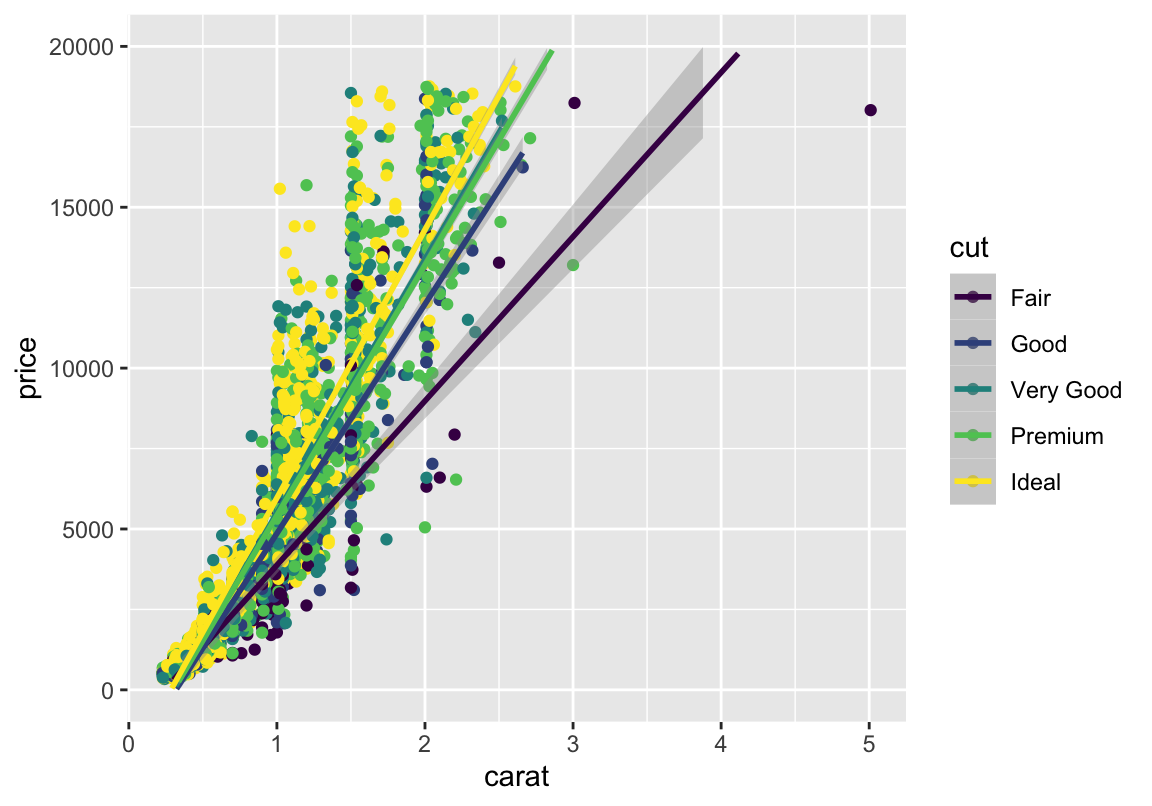
Beschriftungen
Beschriftungen
## `geom_smooth()` using formula 'y ~ x'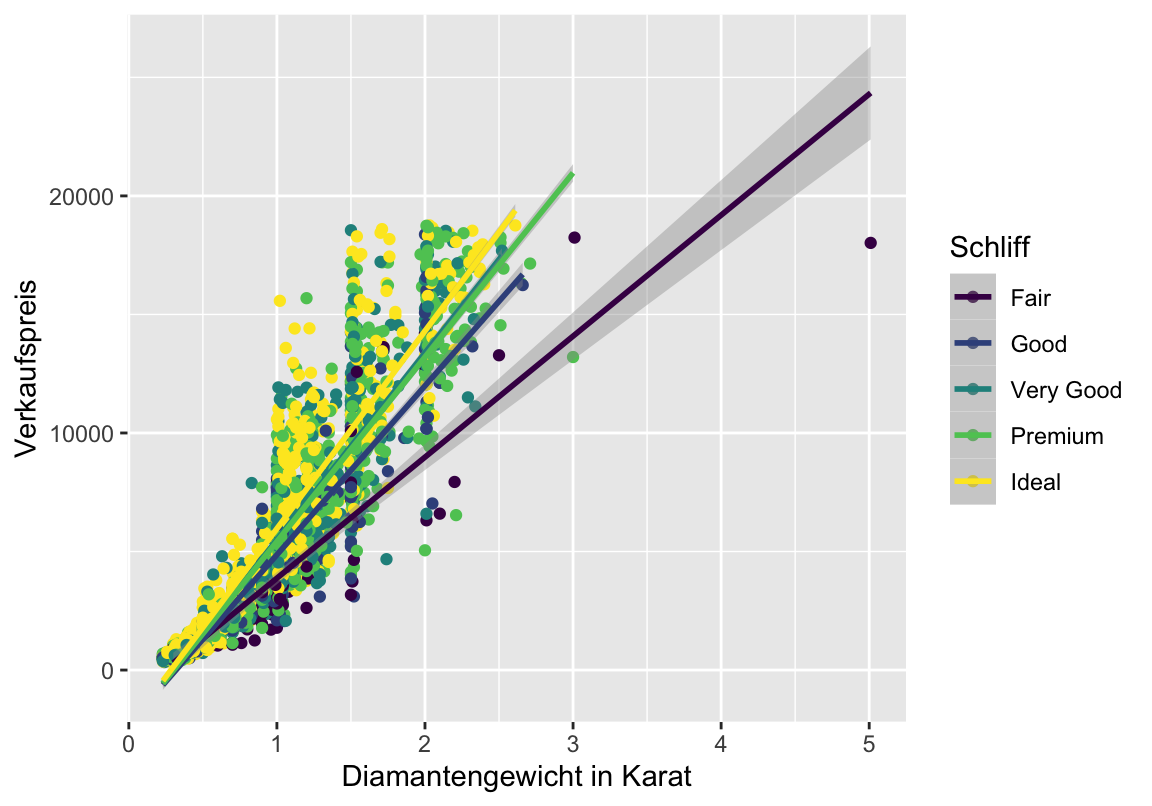
Beschriftungen
## `geom_smooth()` using formula 'y ~ x'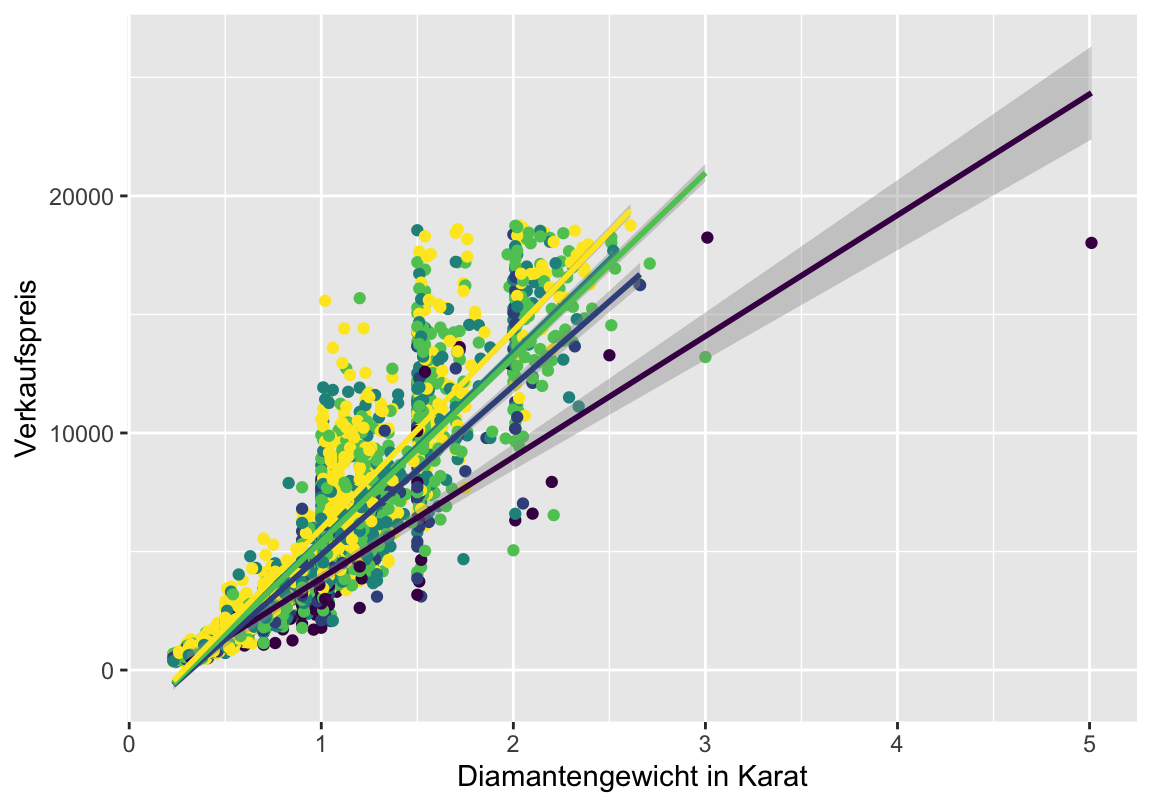
Beschriftungen
## `geom_smooth()` using formula 'y ~ x'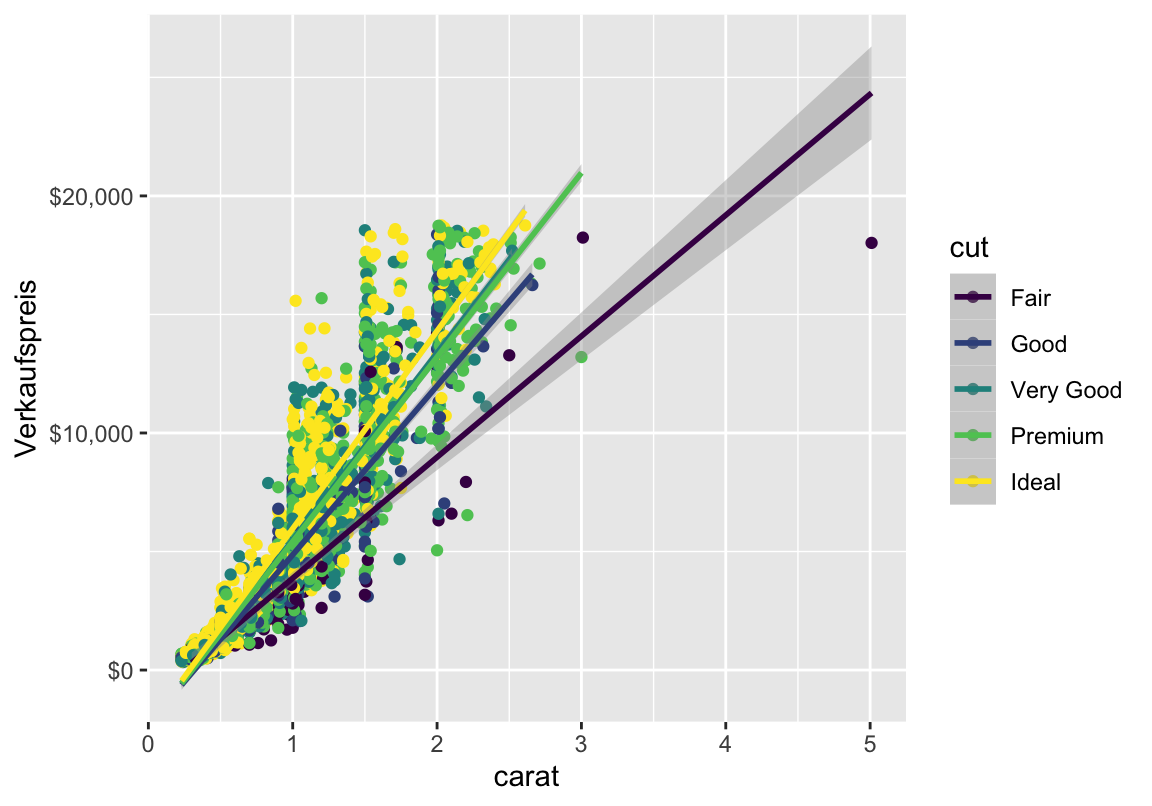
Plots verschönern
Daten für den Basisplot
##                         name      genus  vore        order conservation
## 1                    Cheetah   Acinonyx carni    Carnivora           lc
## 2                 Owl monkey      Aotus  omni     Primates         <NA>
## 3            Mountain beaver Aplodontia herbi     Rodentia           nt
## 4 Greater short-tailed shrew    Blarina  omni Soricomorpha           lc
## 5                        Cow        Bos herbi Artiodactyla domesticated
## 6           Three-toed sloth   Bradypus herbi       Pilosa         <NA>
##   sleep_total sleep_rem sleep_cycle awake brainwt  bodywt
## 1        12.1        NA          NA  11.9      NA  50.000
## 2        17.0       1.8          NA   7.0 0.01550   0.480
## 3        14.4       2.4          NA   9.6      NA   1.350
## 4        14.9       2.3   0.1333333   9.1 0.00029   0.019
## 5         4.0       0.7   0.6666667  20.0 0.42300 600.000
## 6 14.4 2.2 0.7666667 9.6 NA 3.850Möglichkeit 1
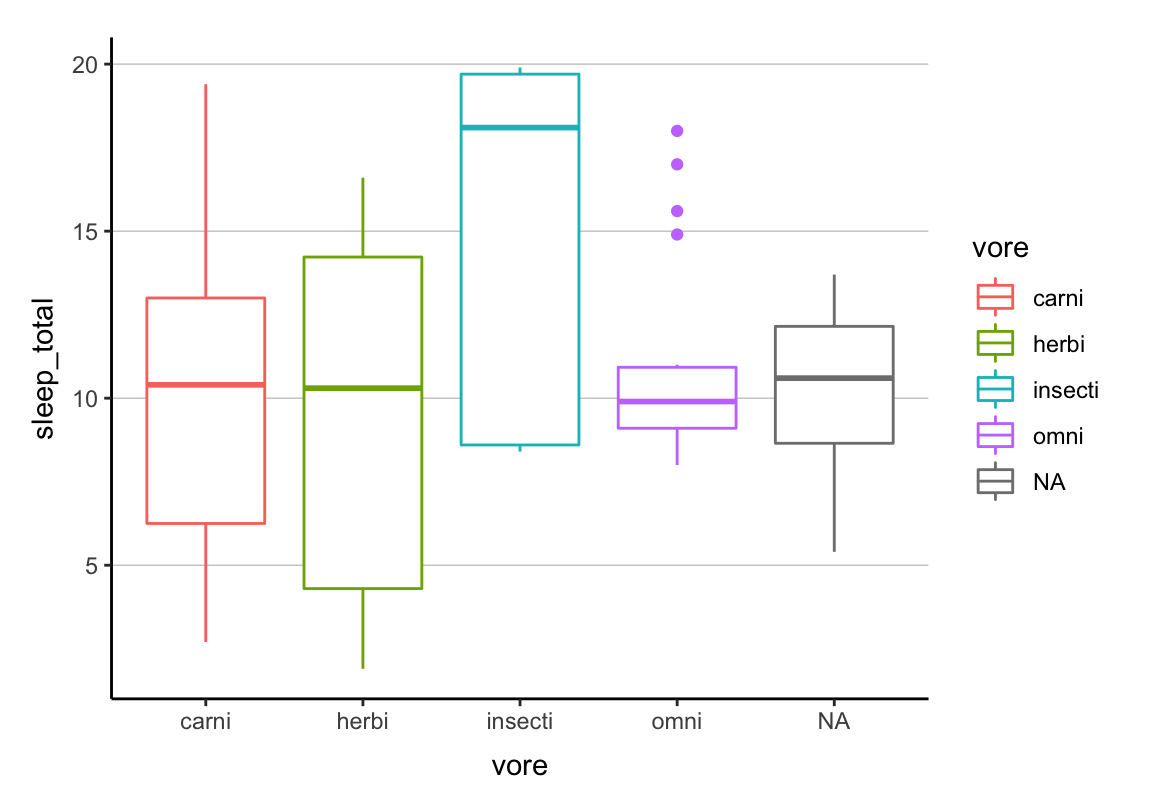
cleanup = theme(axis.line.x = element_line(color = "black"),
  axis.line.y = element_line(color = "black"),
  panel.background = element_rect(fill = "transparent", colour = NA),
  panel.grid.major = element_line(size = .2, color = "gray"),
  panel.grid.major.x = element_blank(),
  legend.background = element_rect(fill = "transparent"),
  axis.title.x = element_text(vjust = -1),
  axis.title.y = element_text(vjust = 2),
  plot.margin = unit(c(.5, .5, .5, .5), "cm"),
  strip.background = element_rect(colour = "black", fill = "transparent"),
  legend.key = element_blank()
)ggthemes
library(ggthemes)
+theme_base() # looks like basic R plot
+theme_tufte()
+theme_minimal()
+theme_gray()
+theme_few()
+theme_wsj()
+theme_economist()
+theme_fivethirtyeight()
+theme_stata()
+theme_hc()
+theme_solarized()
+theme_pander()
+theme_void()
+theme_linedraw()
# to change the font or its size in a theme, use
+theme_bw(base_family = "Times", base_size = "10")
Schriftarten
Legende verändern
p + theme(legend.position = c(0.7, 0.12),
  legend.background = element_rect(linetype = "solid", color = "black"),
  legend.direction = "horizontal")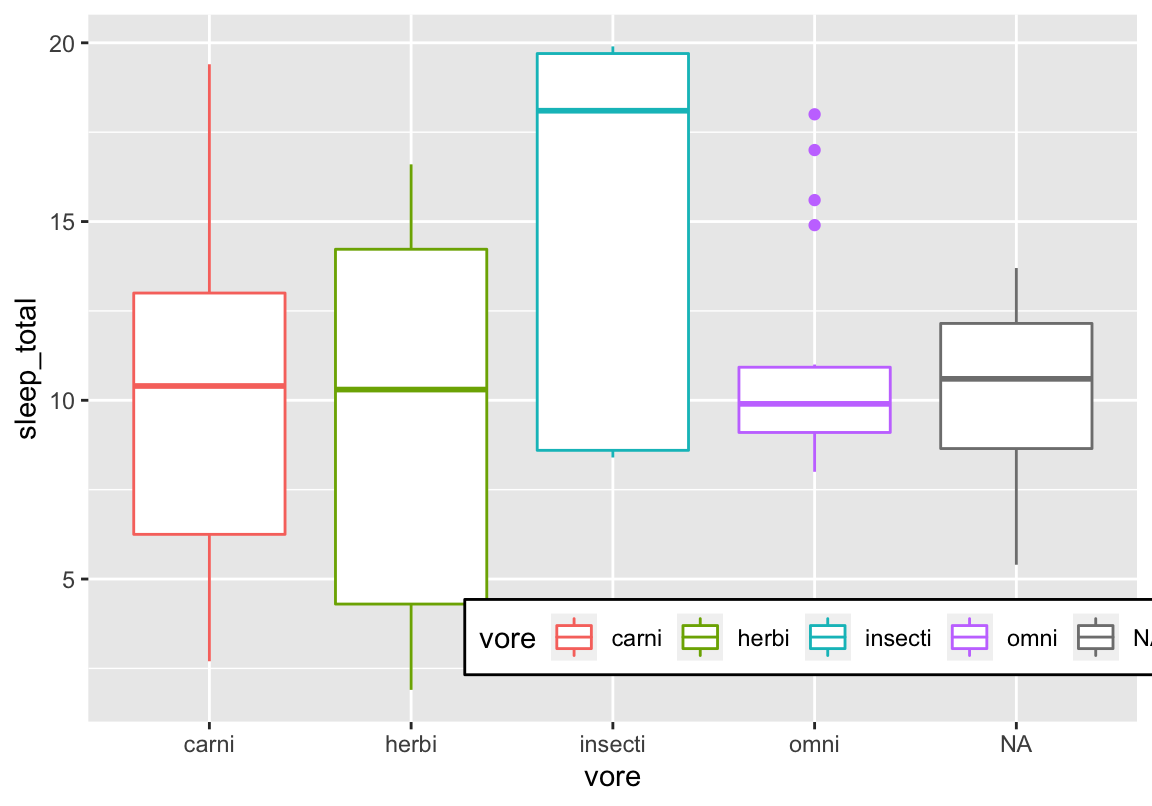
Achsenbeschriftung
p + theme(axis.text.x = element_text(angle = 60, hjust = 1,
  colour = "darkred", size = 12,
  family = "serif", face = "bold"))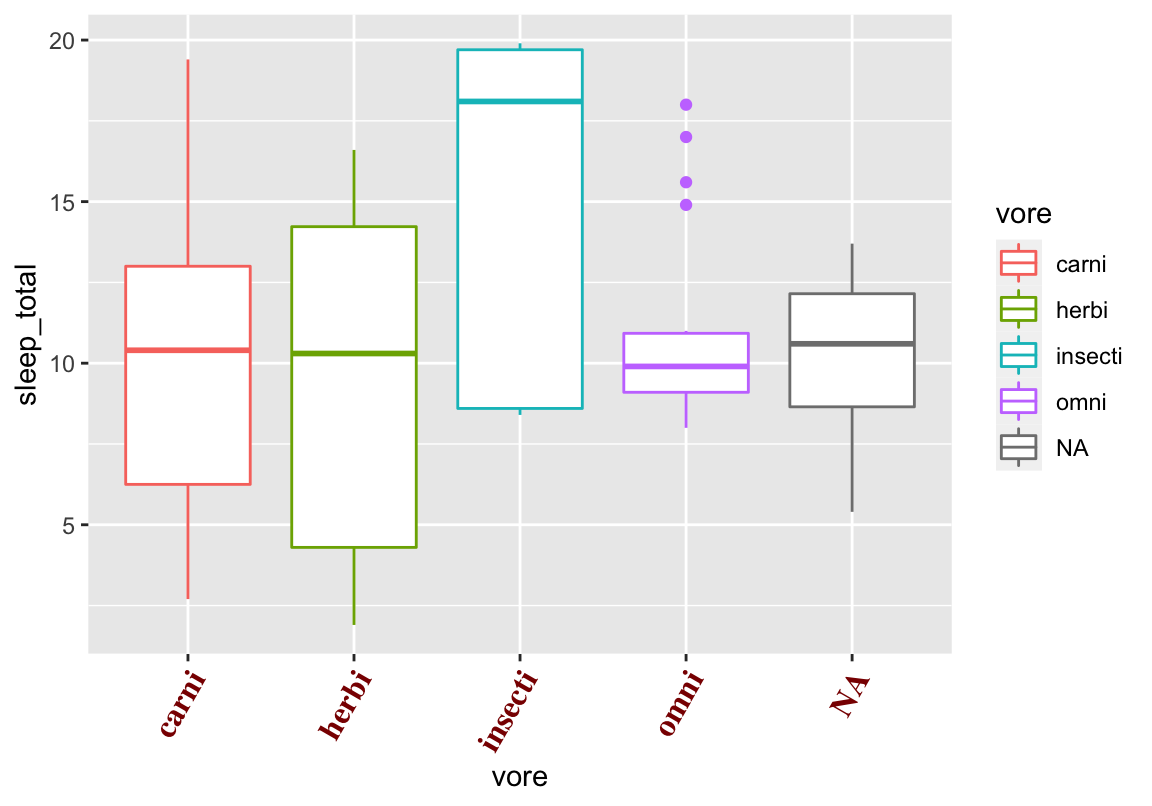
Farbreferenz
Mögliche Farben: http://sape.inf.usi.ch/quick-reference/ggplot2/colour
Vordefinierte Farbpaletten: https://github.com/EmilHvitfeldt/r-color-palettes/blob/master/README.md
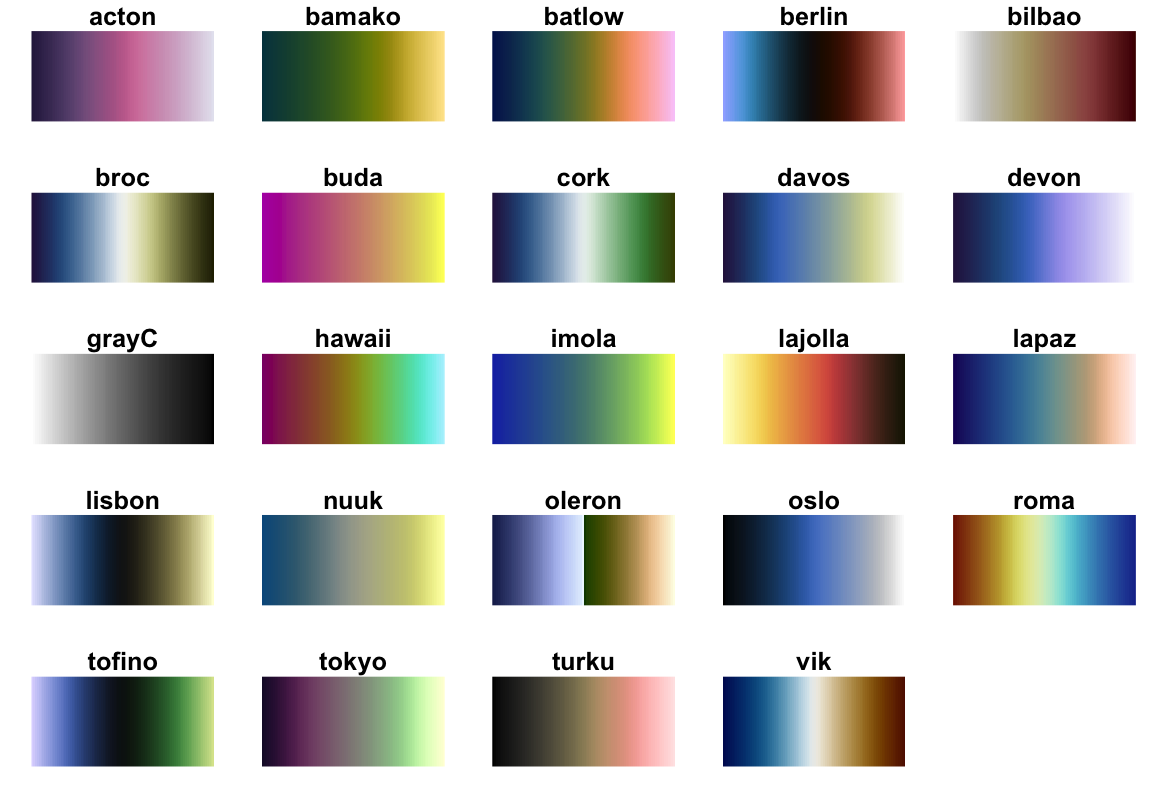
Mein Favorit: https://www.data-imaginist.com/2018/scico-and-the-colour-conundrum/
Palettenvorschau
# palette erstellen (6 farben aus palette "berlin")
COL <- scico(6, palette = "berlin")

# und plotten
ggplot() + aes(x = factor(COL, levels = COL), fill = factor(COL, levels = COL)) +
  geom_bar() +
  scale_fill_manual(values = COL) +
  guides(fill = F) + labs(x = NULL, y = NULL) +
  cleanup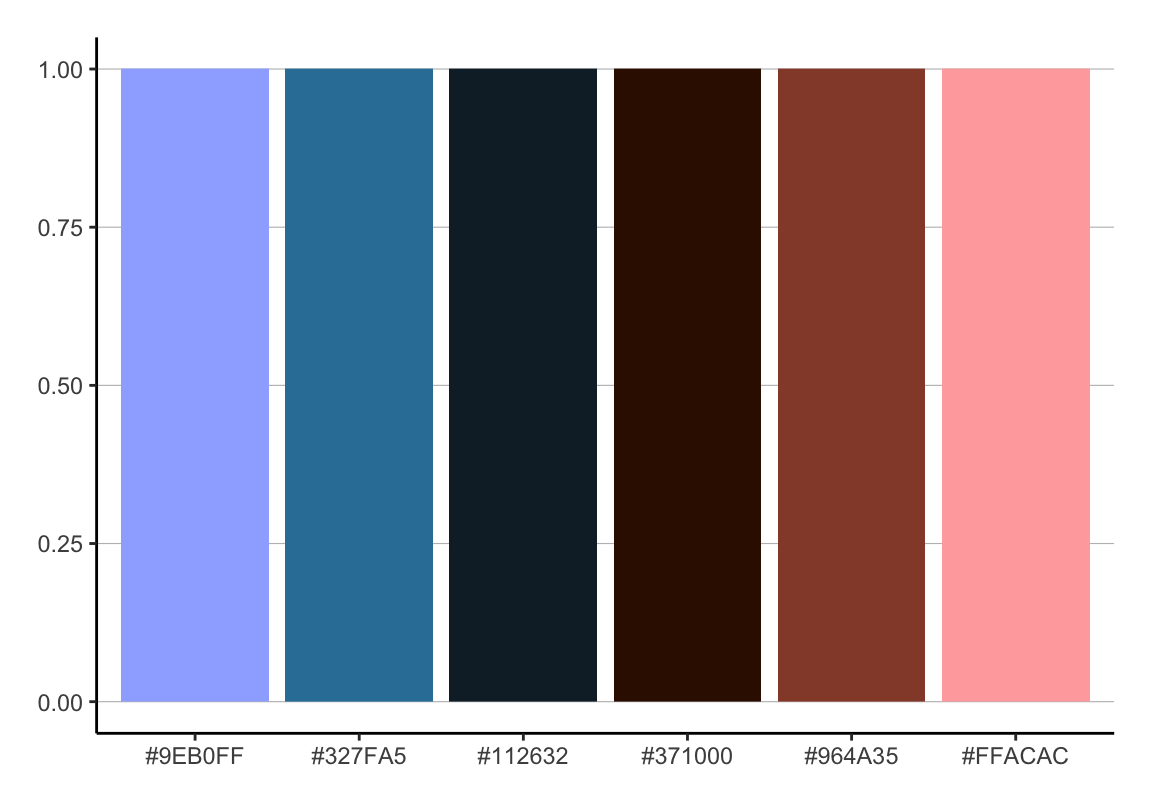
scico in action
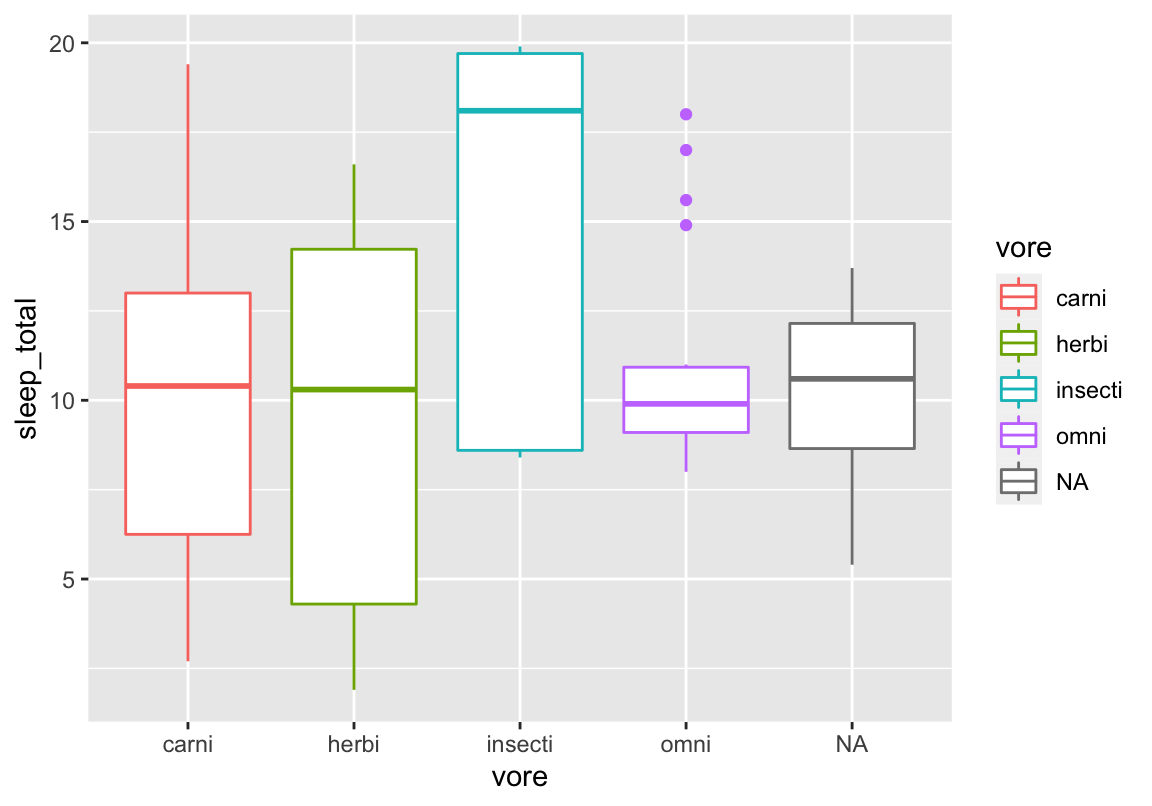
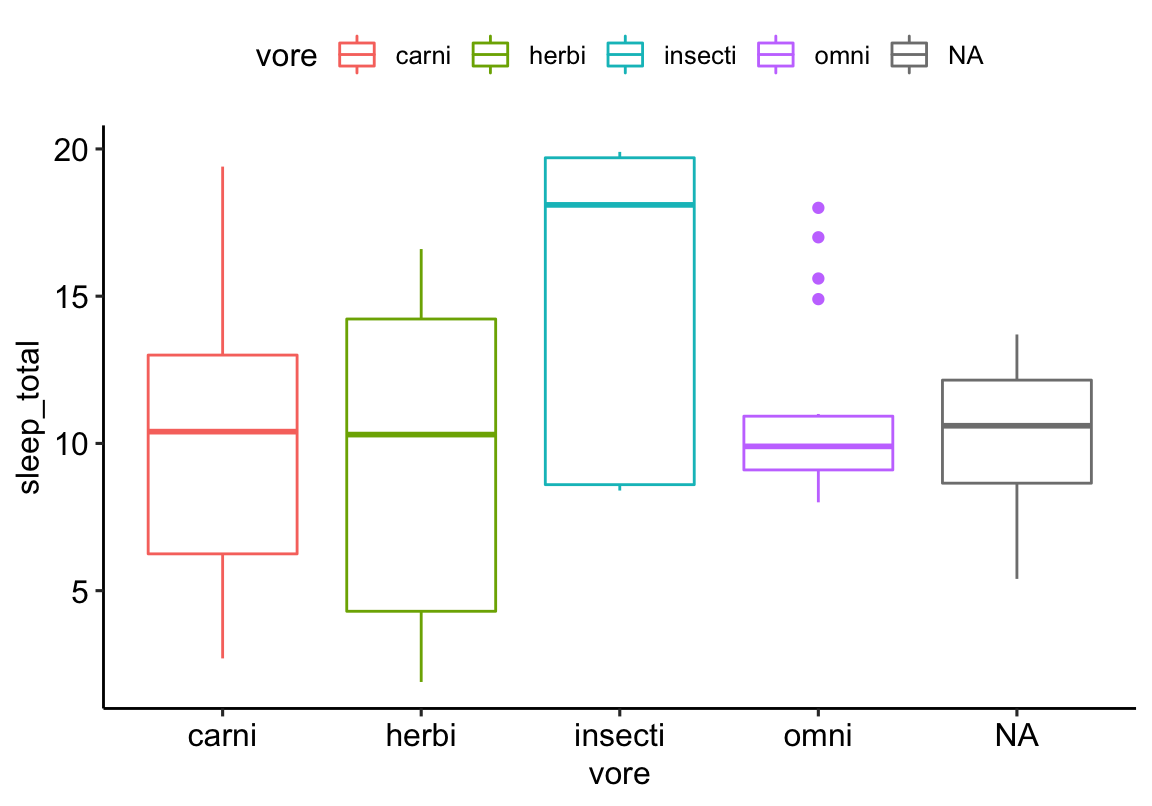
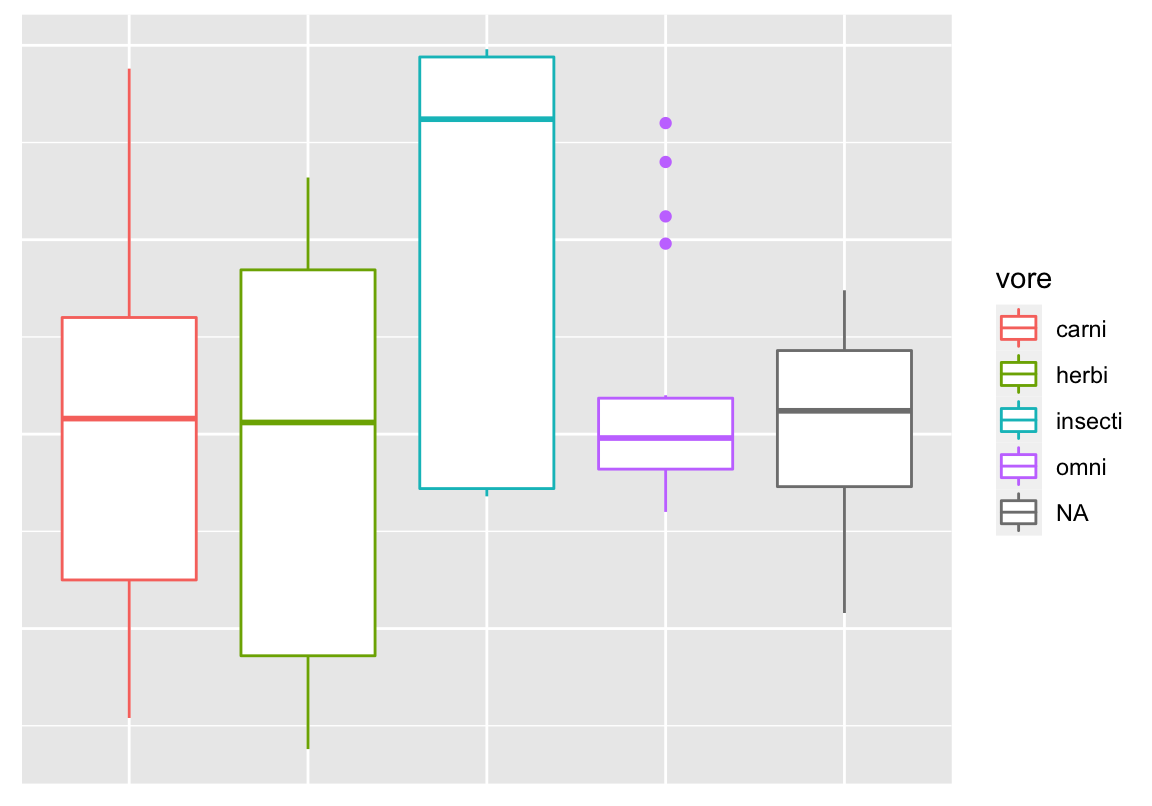
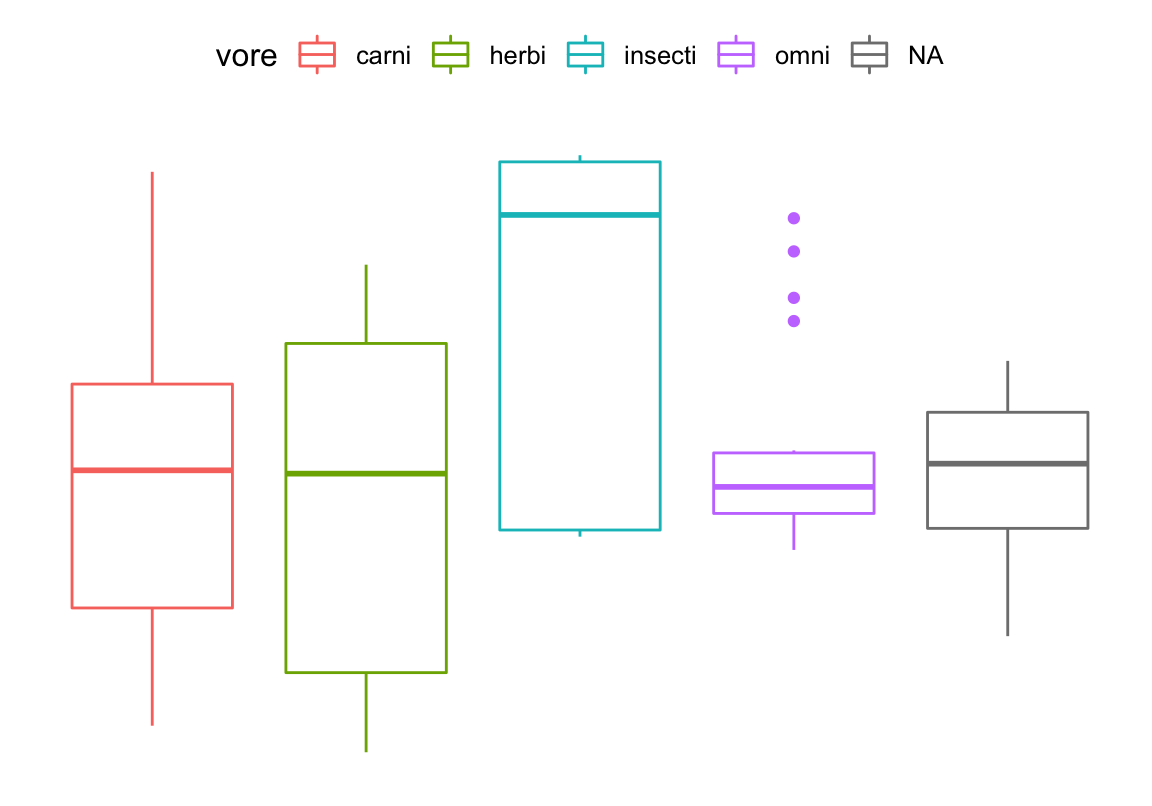
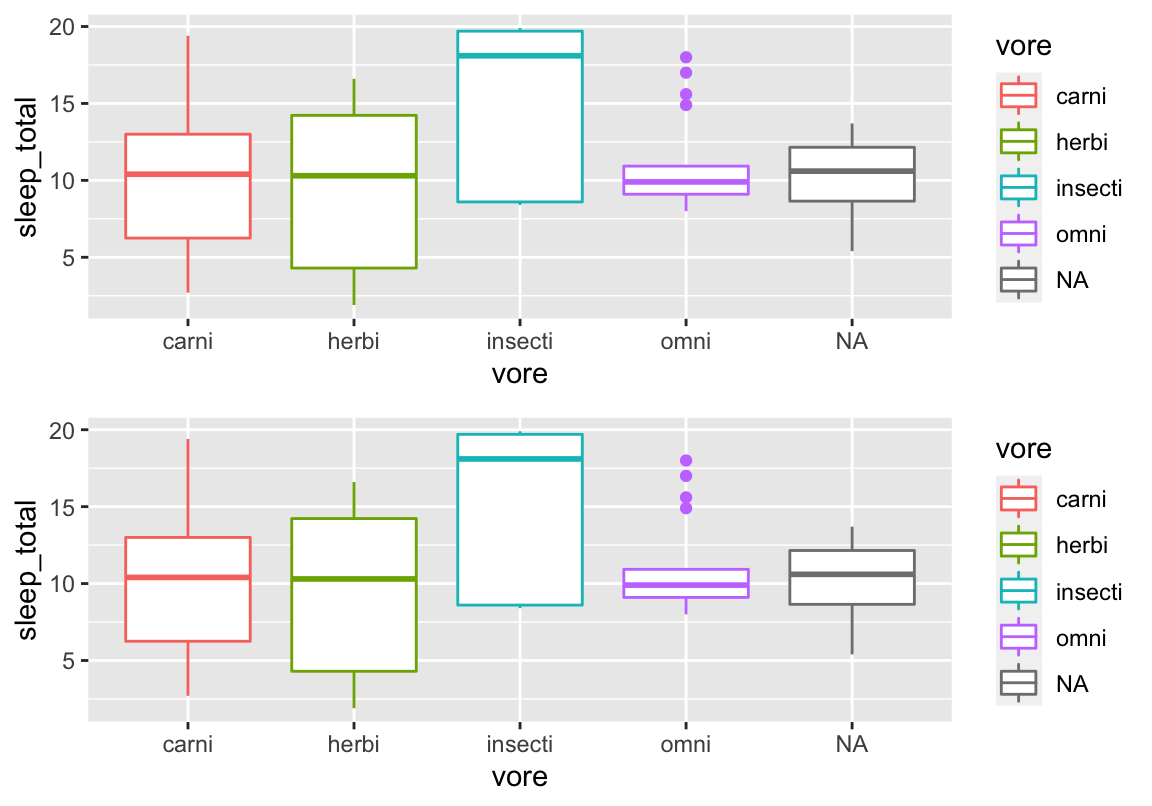
ggplot(d, aes(y = sleep_total, x = vore, fill = vore)) +
  geom_boxplot() +
  scale_fill_scico_d(palette = "tokyo") +
  cleanup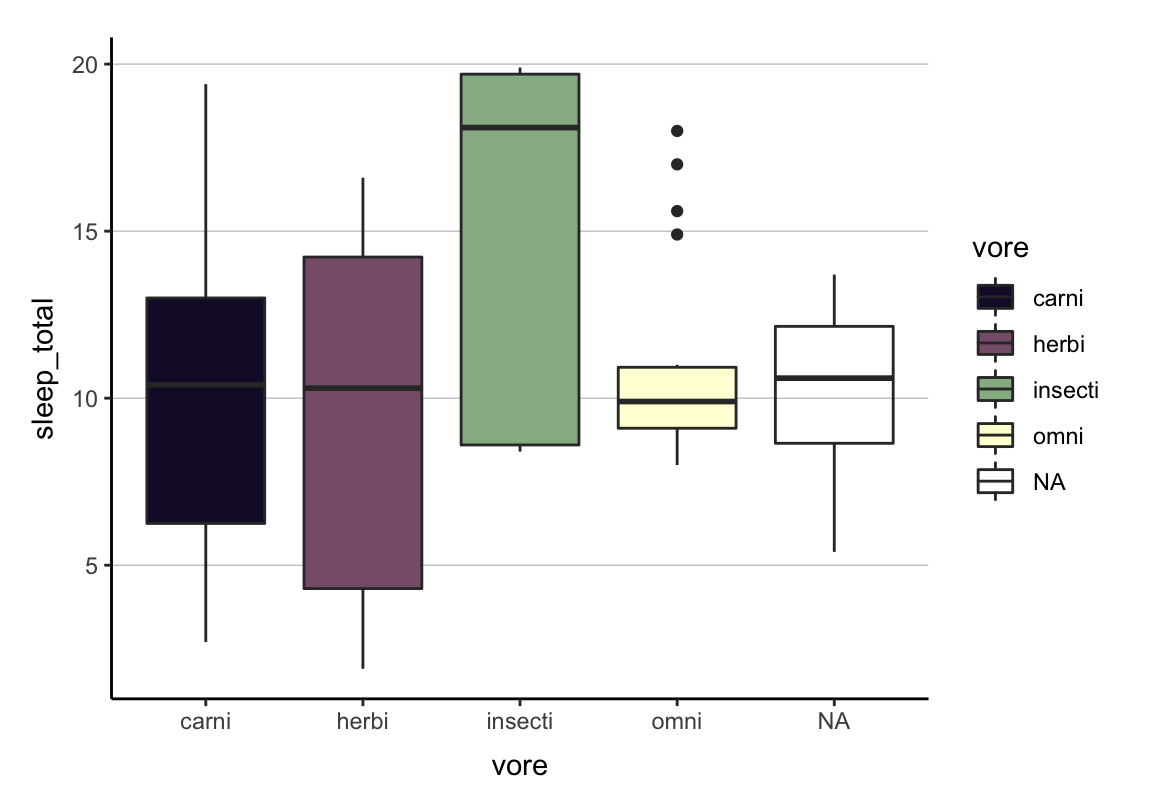
Farbenblindheitschecks:
Wenn ihr Vorträge oÄ haltet und euch für eine Farbpalette entschieden habt, solltet ihr euch versichern, dass auch Zuhörer*innen mit Farbenblindheit die Farben auseinanderhalten können. Einen relativ simplen Check gibt es im Paket prismatic.
# install.packages("prismatic")
library(prismatic)
my_colors <- color(terrain.colors(10))
check_color_blindness(my_colors)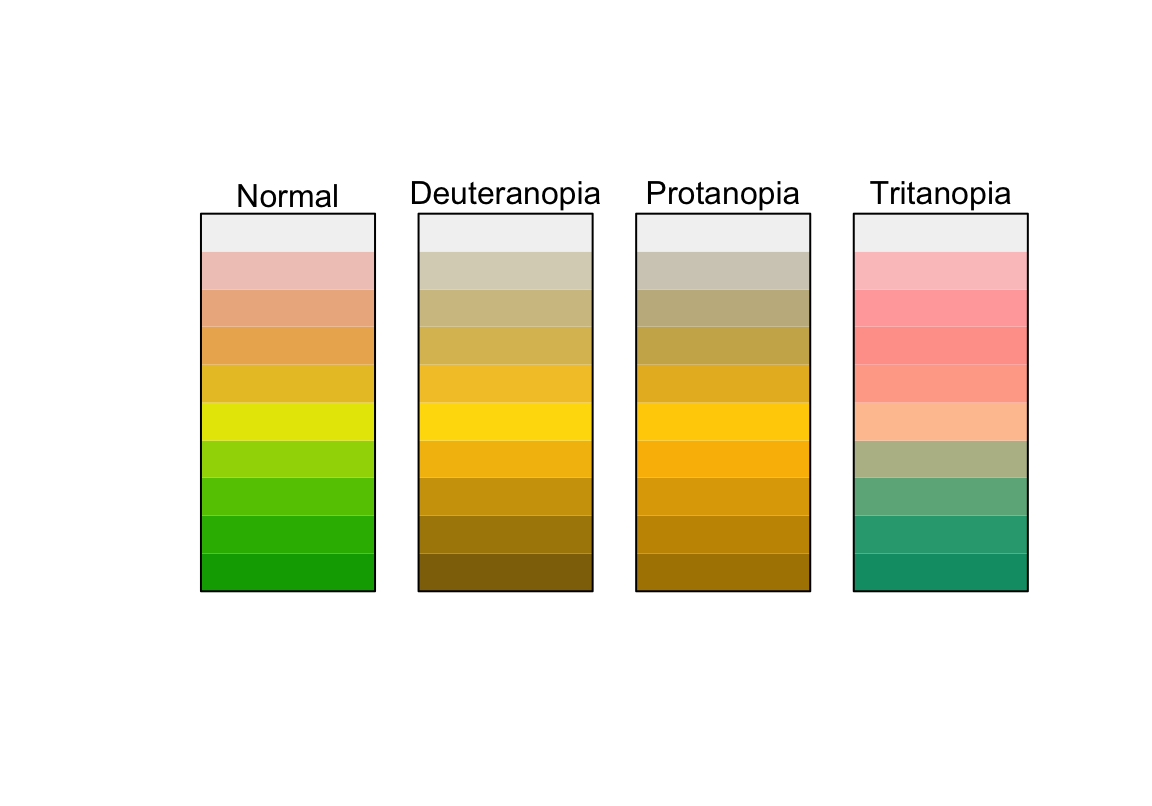
Plot speichern
Plots verbinden
stat_summary()
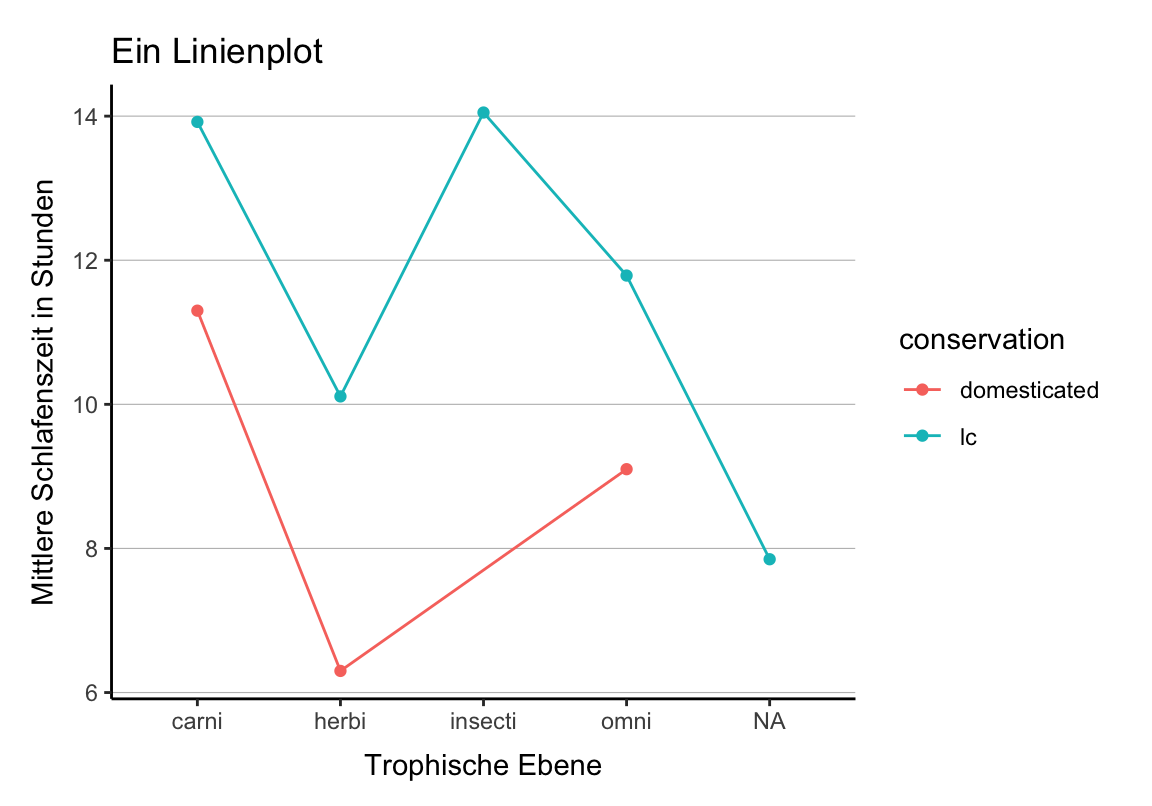
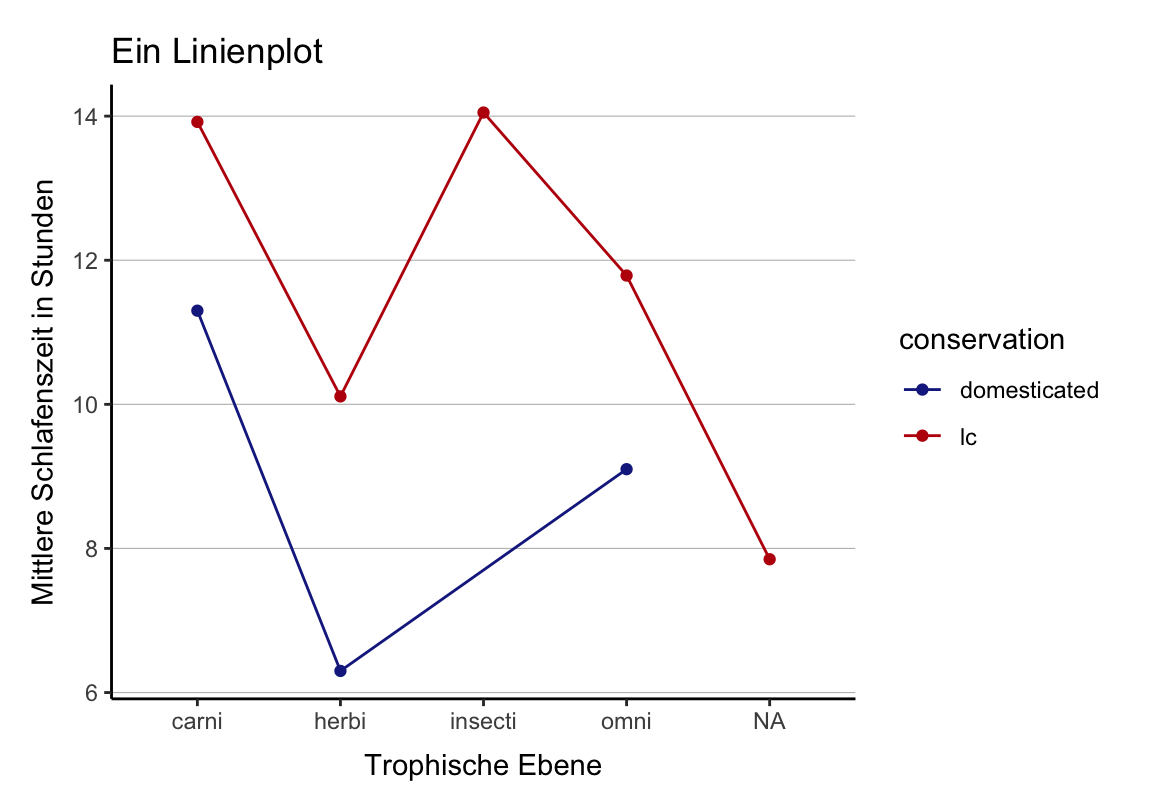
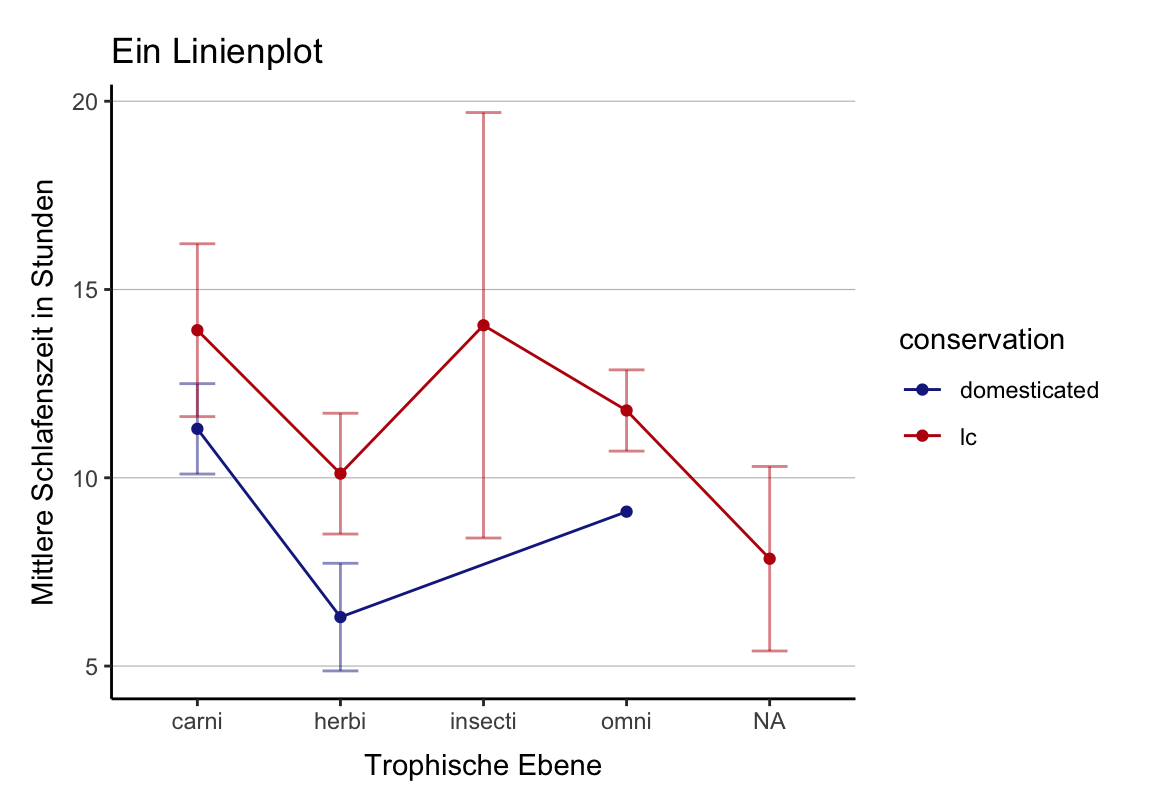
Line Plot
d <- subset(d, d$conservation %in% c("domesticated", "lc"))
p <- ggplot(d, aes(x = vore, y = sleep_total,
  color = conservation, group = conservation)) +
  stat_summary(fun.y = mean, geom = "line") +
  stat_summary(fun.y = mean, geom = "point") +
  labs(x = "Trophische Ebene",
    y = "Mittlere Schlafenszeit in Stunden",
title = "Ein Linienplot")Fehlerbalken
Fehlerbalken
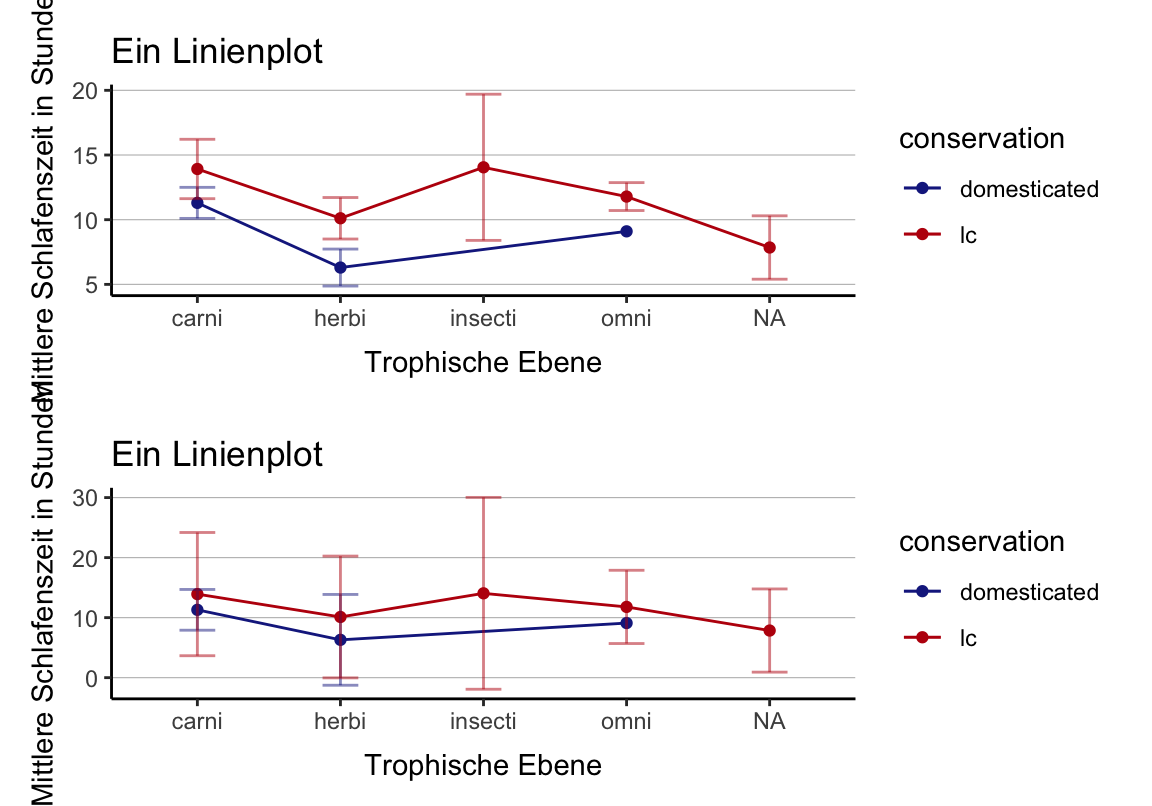
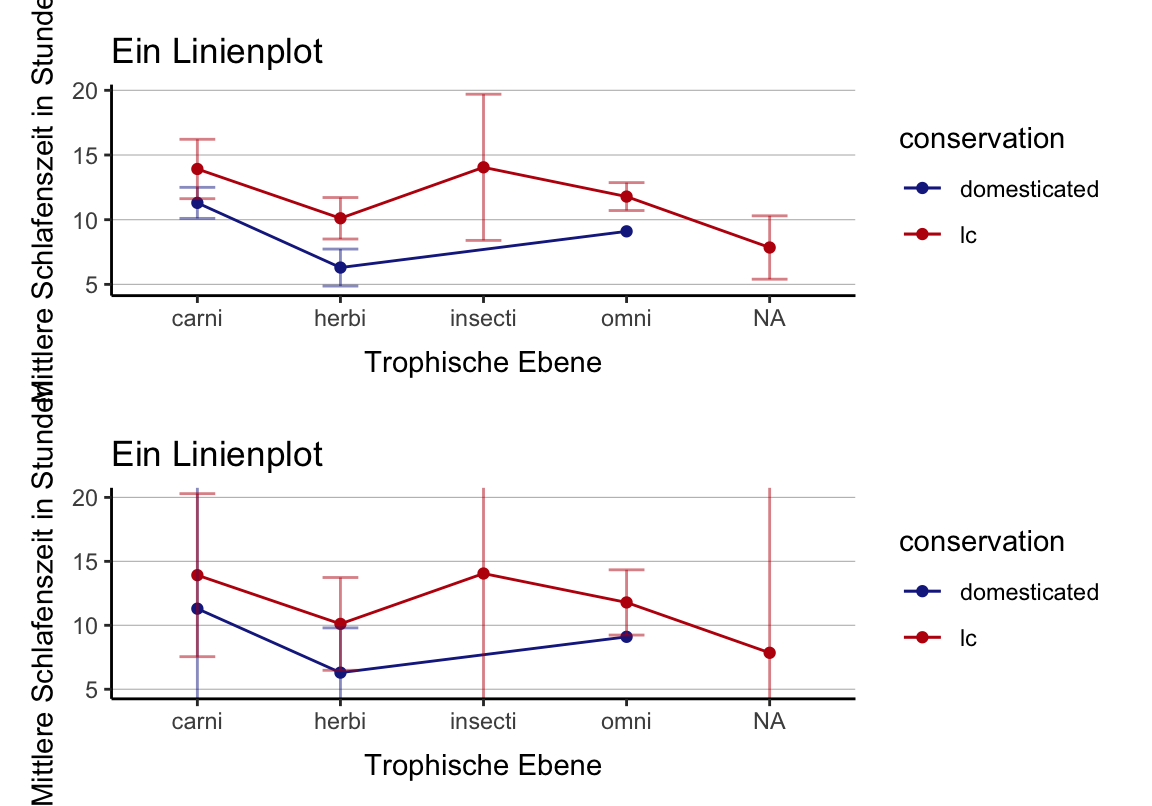
Standardfehler
Andere Fehlerbalken
Standardfehler vs Standardabweichung
Andere Fehlerbalken
95% Konfidenzintervall
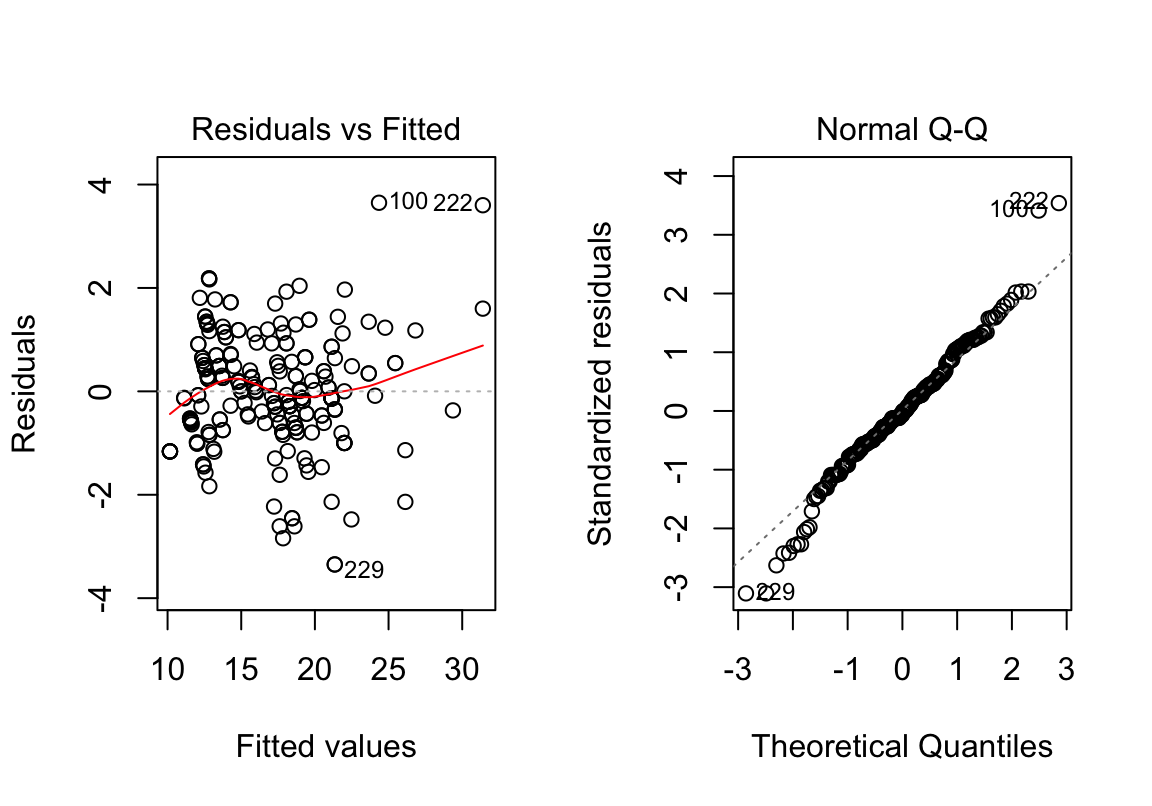
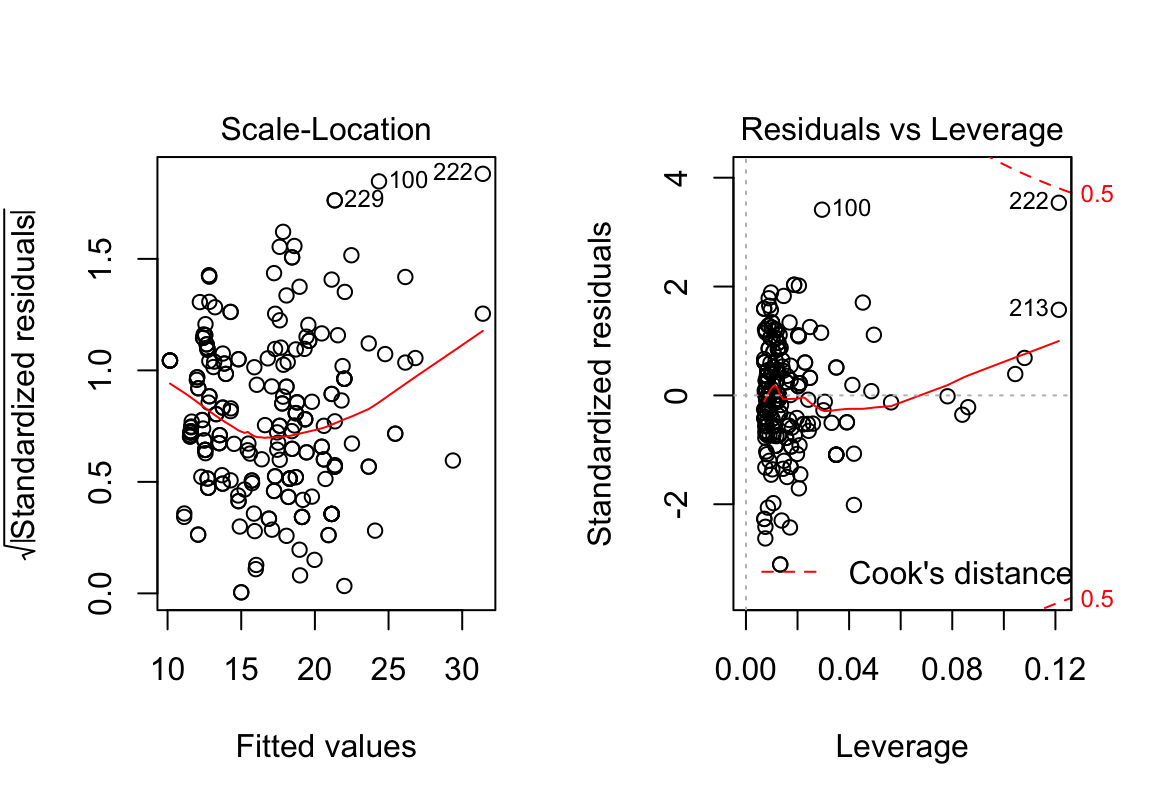
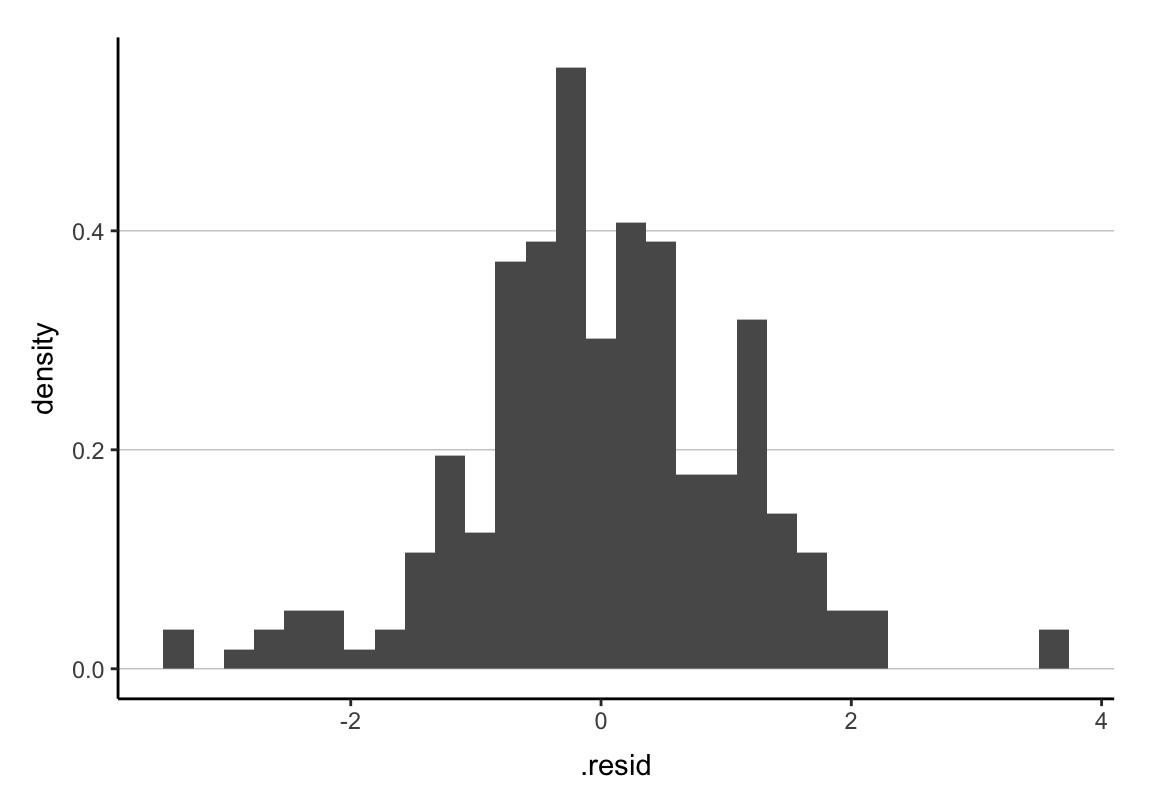
Diagnostische Plots
Diagnostikfunktion
library(qqplotr) # stat_qq_band

diagPlot <- function(model) {
  p1 <- ggplot(model, aes(.fitted, .resid)) + geom_point()
  p1 <- p1 + stat_smooth(method = "loess")
  p1 <- p1 + geom_hline(yintercept = 0, col = "red",
    linetype = "dashed")
  p1 <- p1 + labs(x = "Fitted values", y = "Residuals",
    title = "Residual vs Fitted Plot")

  p2 <- ggplot(model, aes(qqnorm(.stdresid)[[1]], .stdresid))
  p2 <- p2 + stat_qq_band(mapping = aes(sample = qqnorm(.stdresid)[[1]]),
    alpha = .6)
  p2 <- p2 + geom_point(na.rm = TRUE) + geom_abline()
  p2 <- p2 + labs(x = "Theoretical Quantiles",
    y = "Standardized Residuals",
    title = "Normal Q-Q")

  return(list(rvfPlot = p1, qqPlot = p2))
}
Plots
diagPlts <- diagPlot(lm(cty ~ displ * hwy, data = mpg))
plot <- grid.arrange(grobs = diagPlts, ncol = 2)
## `geom_smooth()` using formula 'y ~ x'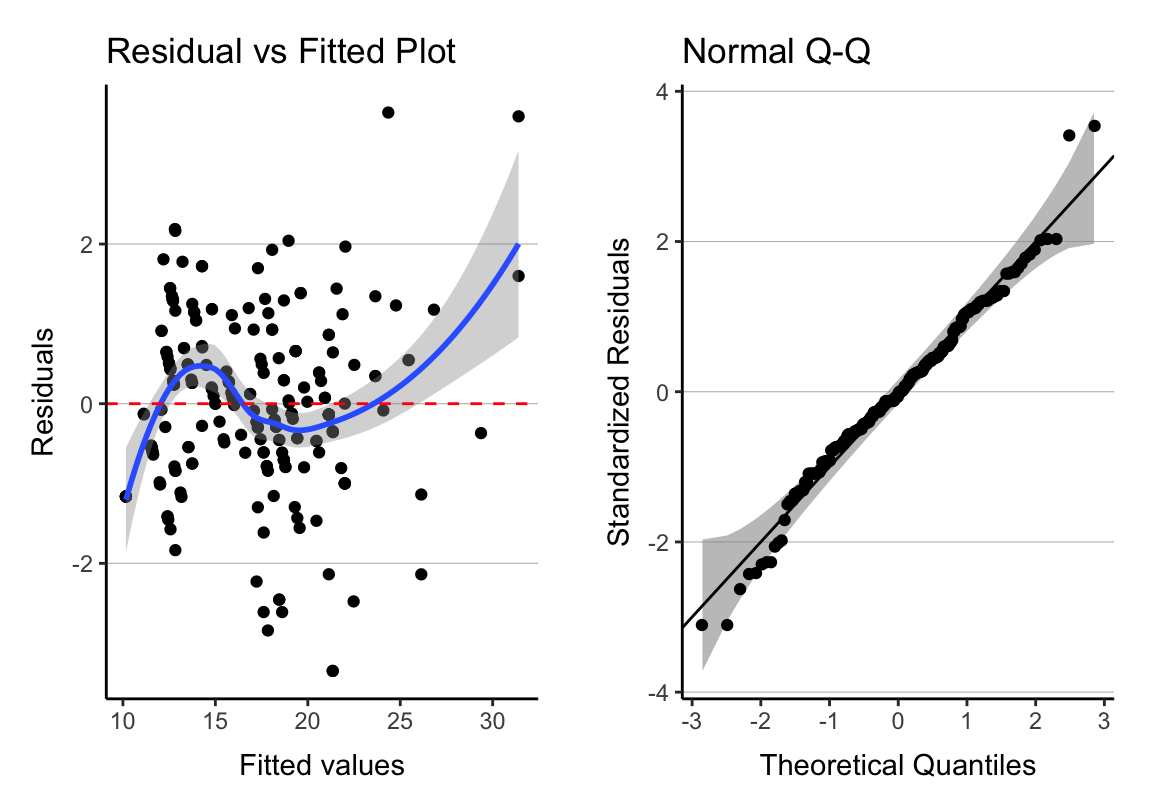
Weitere Alternative
Von mir nicht getestet! Erstellt die bekannten diagnostischen Plots.
Normalverteilung
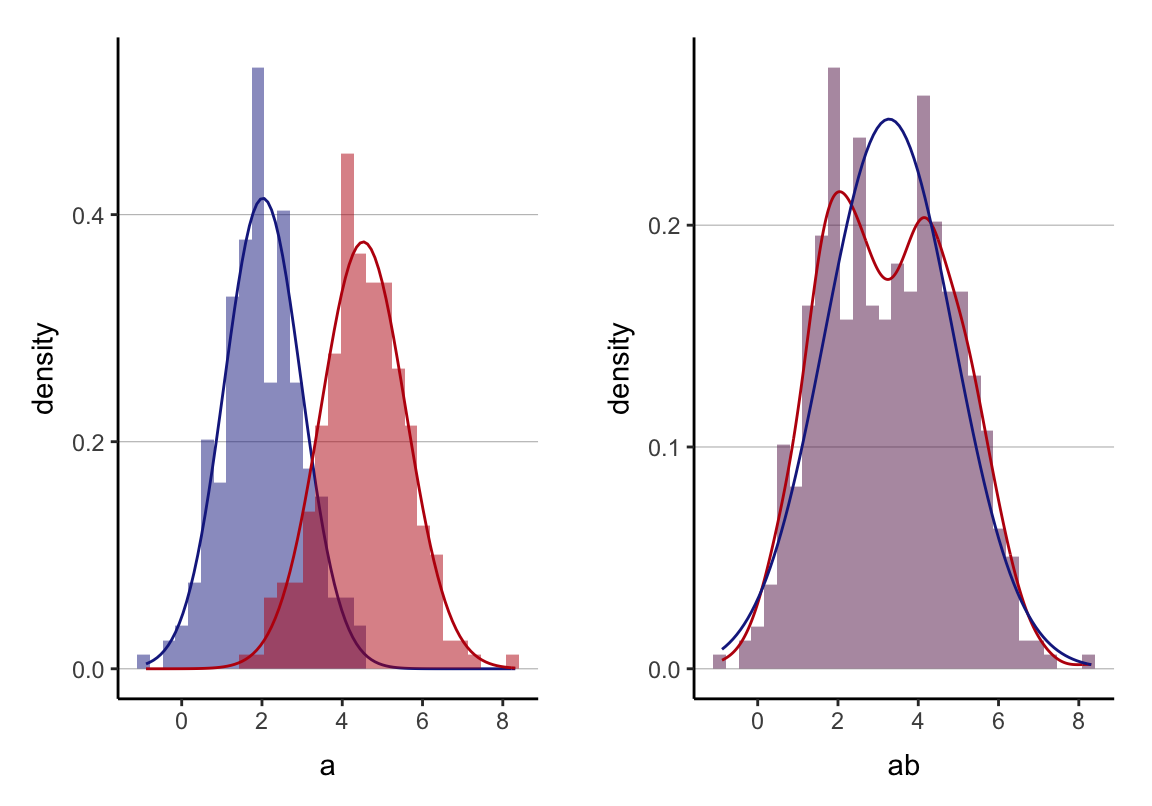
Normalverteilung: Daten
# sicherstellen, dass ihr die gleichen "zufällig"
# erstellten daten bekommt
set.seed(1)


# normalverteile daten generieren
a <- rnorm(250, mean = 2, sd = 1)
b <- rnorm(250, mean = 4.5, sd = 1)

# datenblatt erstellen
d <- data.frame(a, b)

# daten kombinieren und neues datenblatt
ab <- c(a, b)
d2 <- data.frame(ab)
shapiro.test
##
##  Shapiro-Wilk normality test
##
## data:  a
## W = 0.9964, p-value = 0.8398##
## Shapiro-Wilk normality test
##
## data: b
## W = 0.9968, p-value = 0.897##
## Shapiro-Wilk normality test
##
## data: ab
## W = 0.98647, p-value = 0.0001351Normalverteilung: Daten
# beide Verteilungen getrennt
p1 <- ggplot(d) + geom_histogram(mapping = aes(x = a, y = ..density..),
  fill = "#19278e", alpha = .5) +
  stat_function(fun = dnorm,
    args = list(mean = mean(d$a), sd = sd(d$a)),
    color = "#19278e", geom = "line") +
  geom_histogram(mapping = aes(x = b, y = ..density..),
    fill = "#BC0D0D", alpha = .5) +
  stat_function(fun = dnorm,
    args = list(mean = mean(d$b), sd = sd(d$b)),
    color = "#BC0D0D", geom = "line") +
  cleanup

# beide Verteilungen kombiniert
p2 <- ggplot(d2) + geom_histogram(mapping = aes(x = ab, y = ..density..),
  fill = "#621b54", alpha = .5) +
  stat_density(aes(x = ab, y = ..density..),
    color = "#BC0D0D",
    adjust = 1,
    geom = "line") +
  stat_function(fun = dnorm,
    args = list(mean = mean(d2$ab), sd = sd(d2$ab)),
    color = "#19278e", geom = "line") +
cleanupBoxplot verbessern
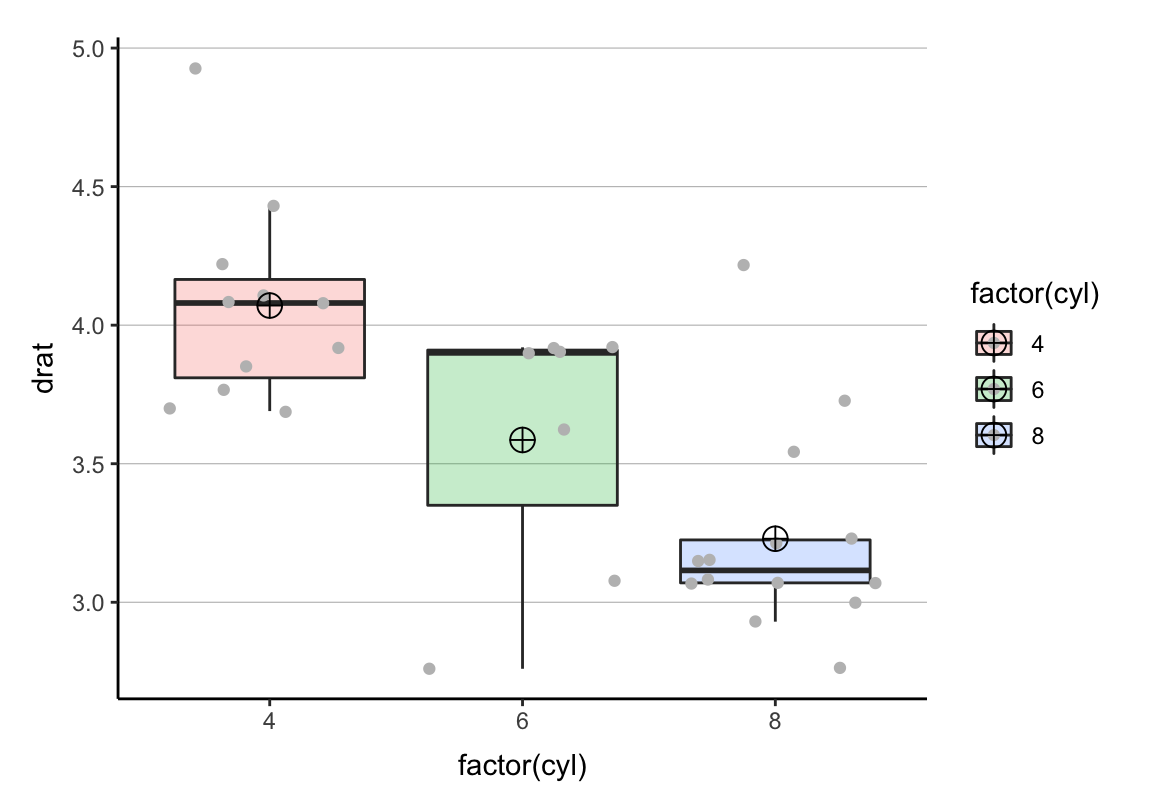
Mittelwerte in Boxplots
p <- ggplot(mtcars, aes(x = factor(cyl), y = drat, fill = factor(cyl))) +
  geom_boxplot(alpha = .25, outlier.alpha = 0) +
  geom_jitter(color = "grey") +
  stat_summary(fun.y = mean, geom = "point", shape = 10,
    size = 4, position = position_dodge(0.75)) +
  cleanup
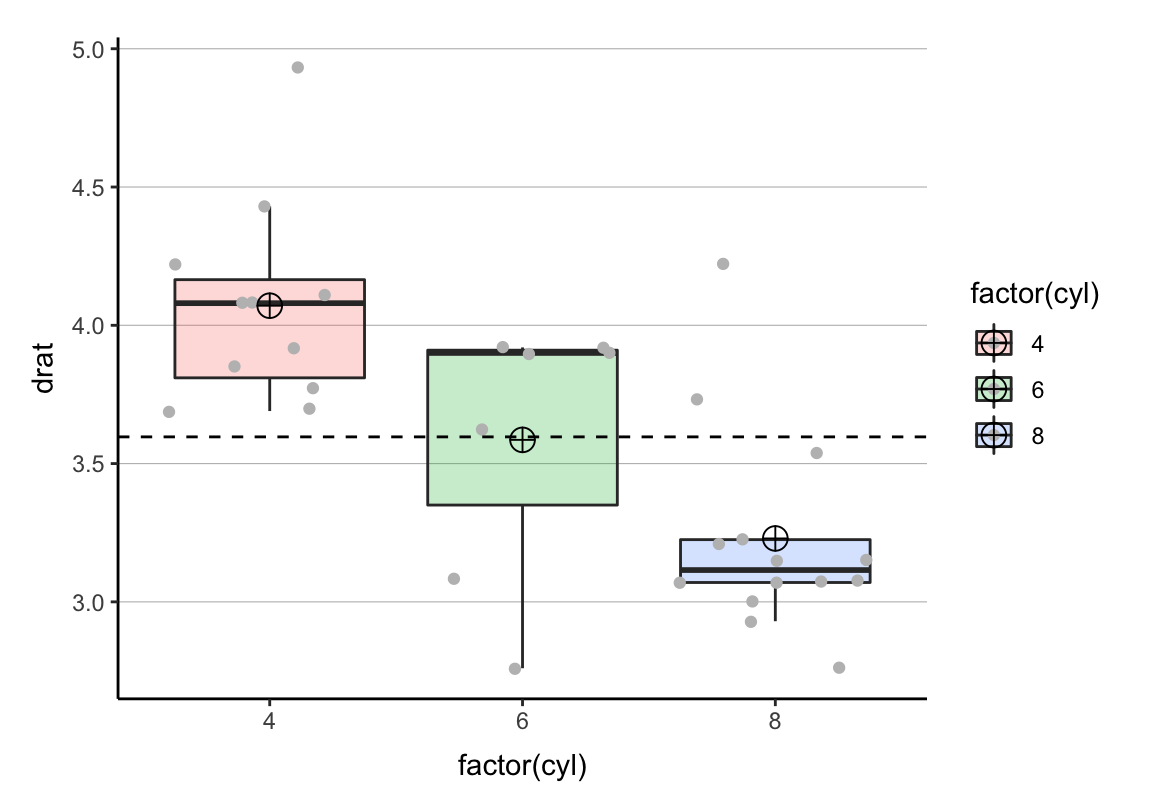
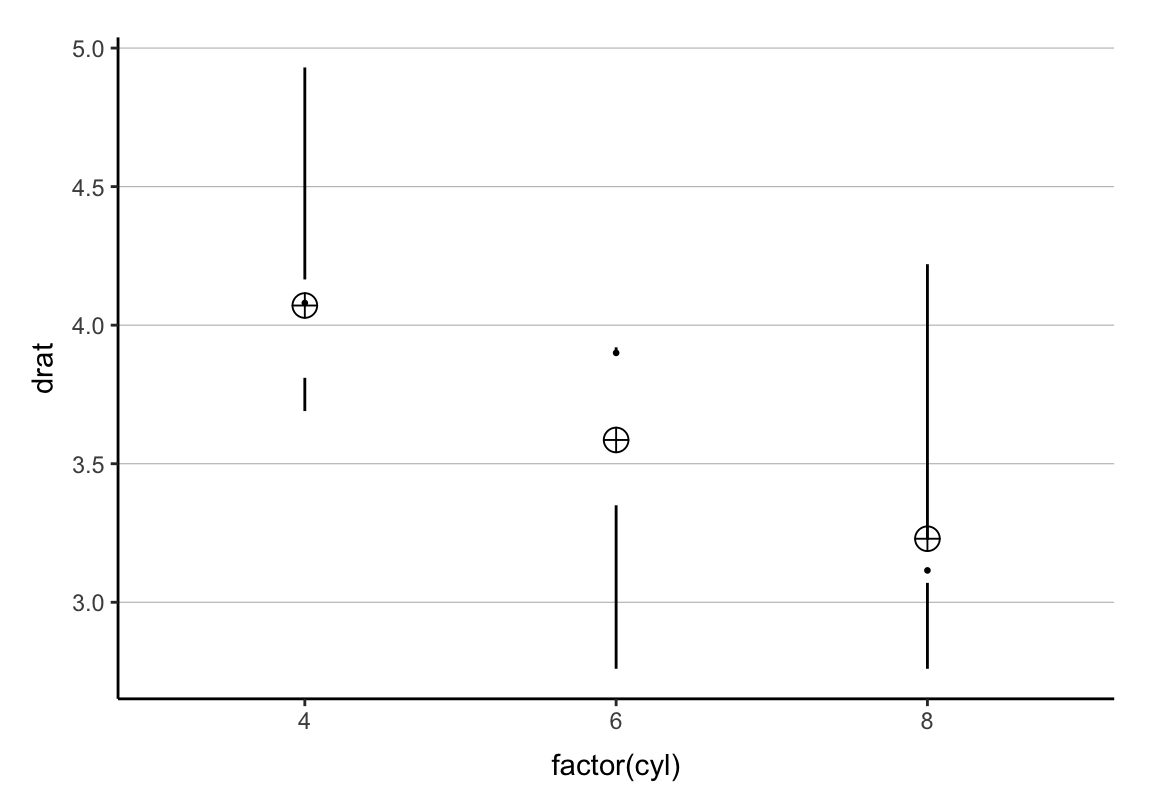
## Warning: `fun.y` is deprecated. Use `fun` instead.Tufte-Boxplots
p <- ggplot(mtcars, aes(x = factor(cyl), y = drat)) +
  geom_tufteboxplot() +
  stat_summary(fun.y = mean, geom = "point", shape = 10,
    size = 4, position = position_dodge(0.75)) +
  cleanup
## Warning: `fun.y` is deprecated. Use `fun` instead.Übung
- Baut den folgenden Plot (“class_cl.csv”) nach.
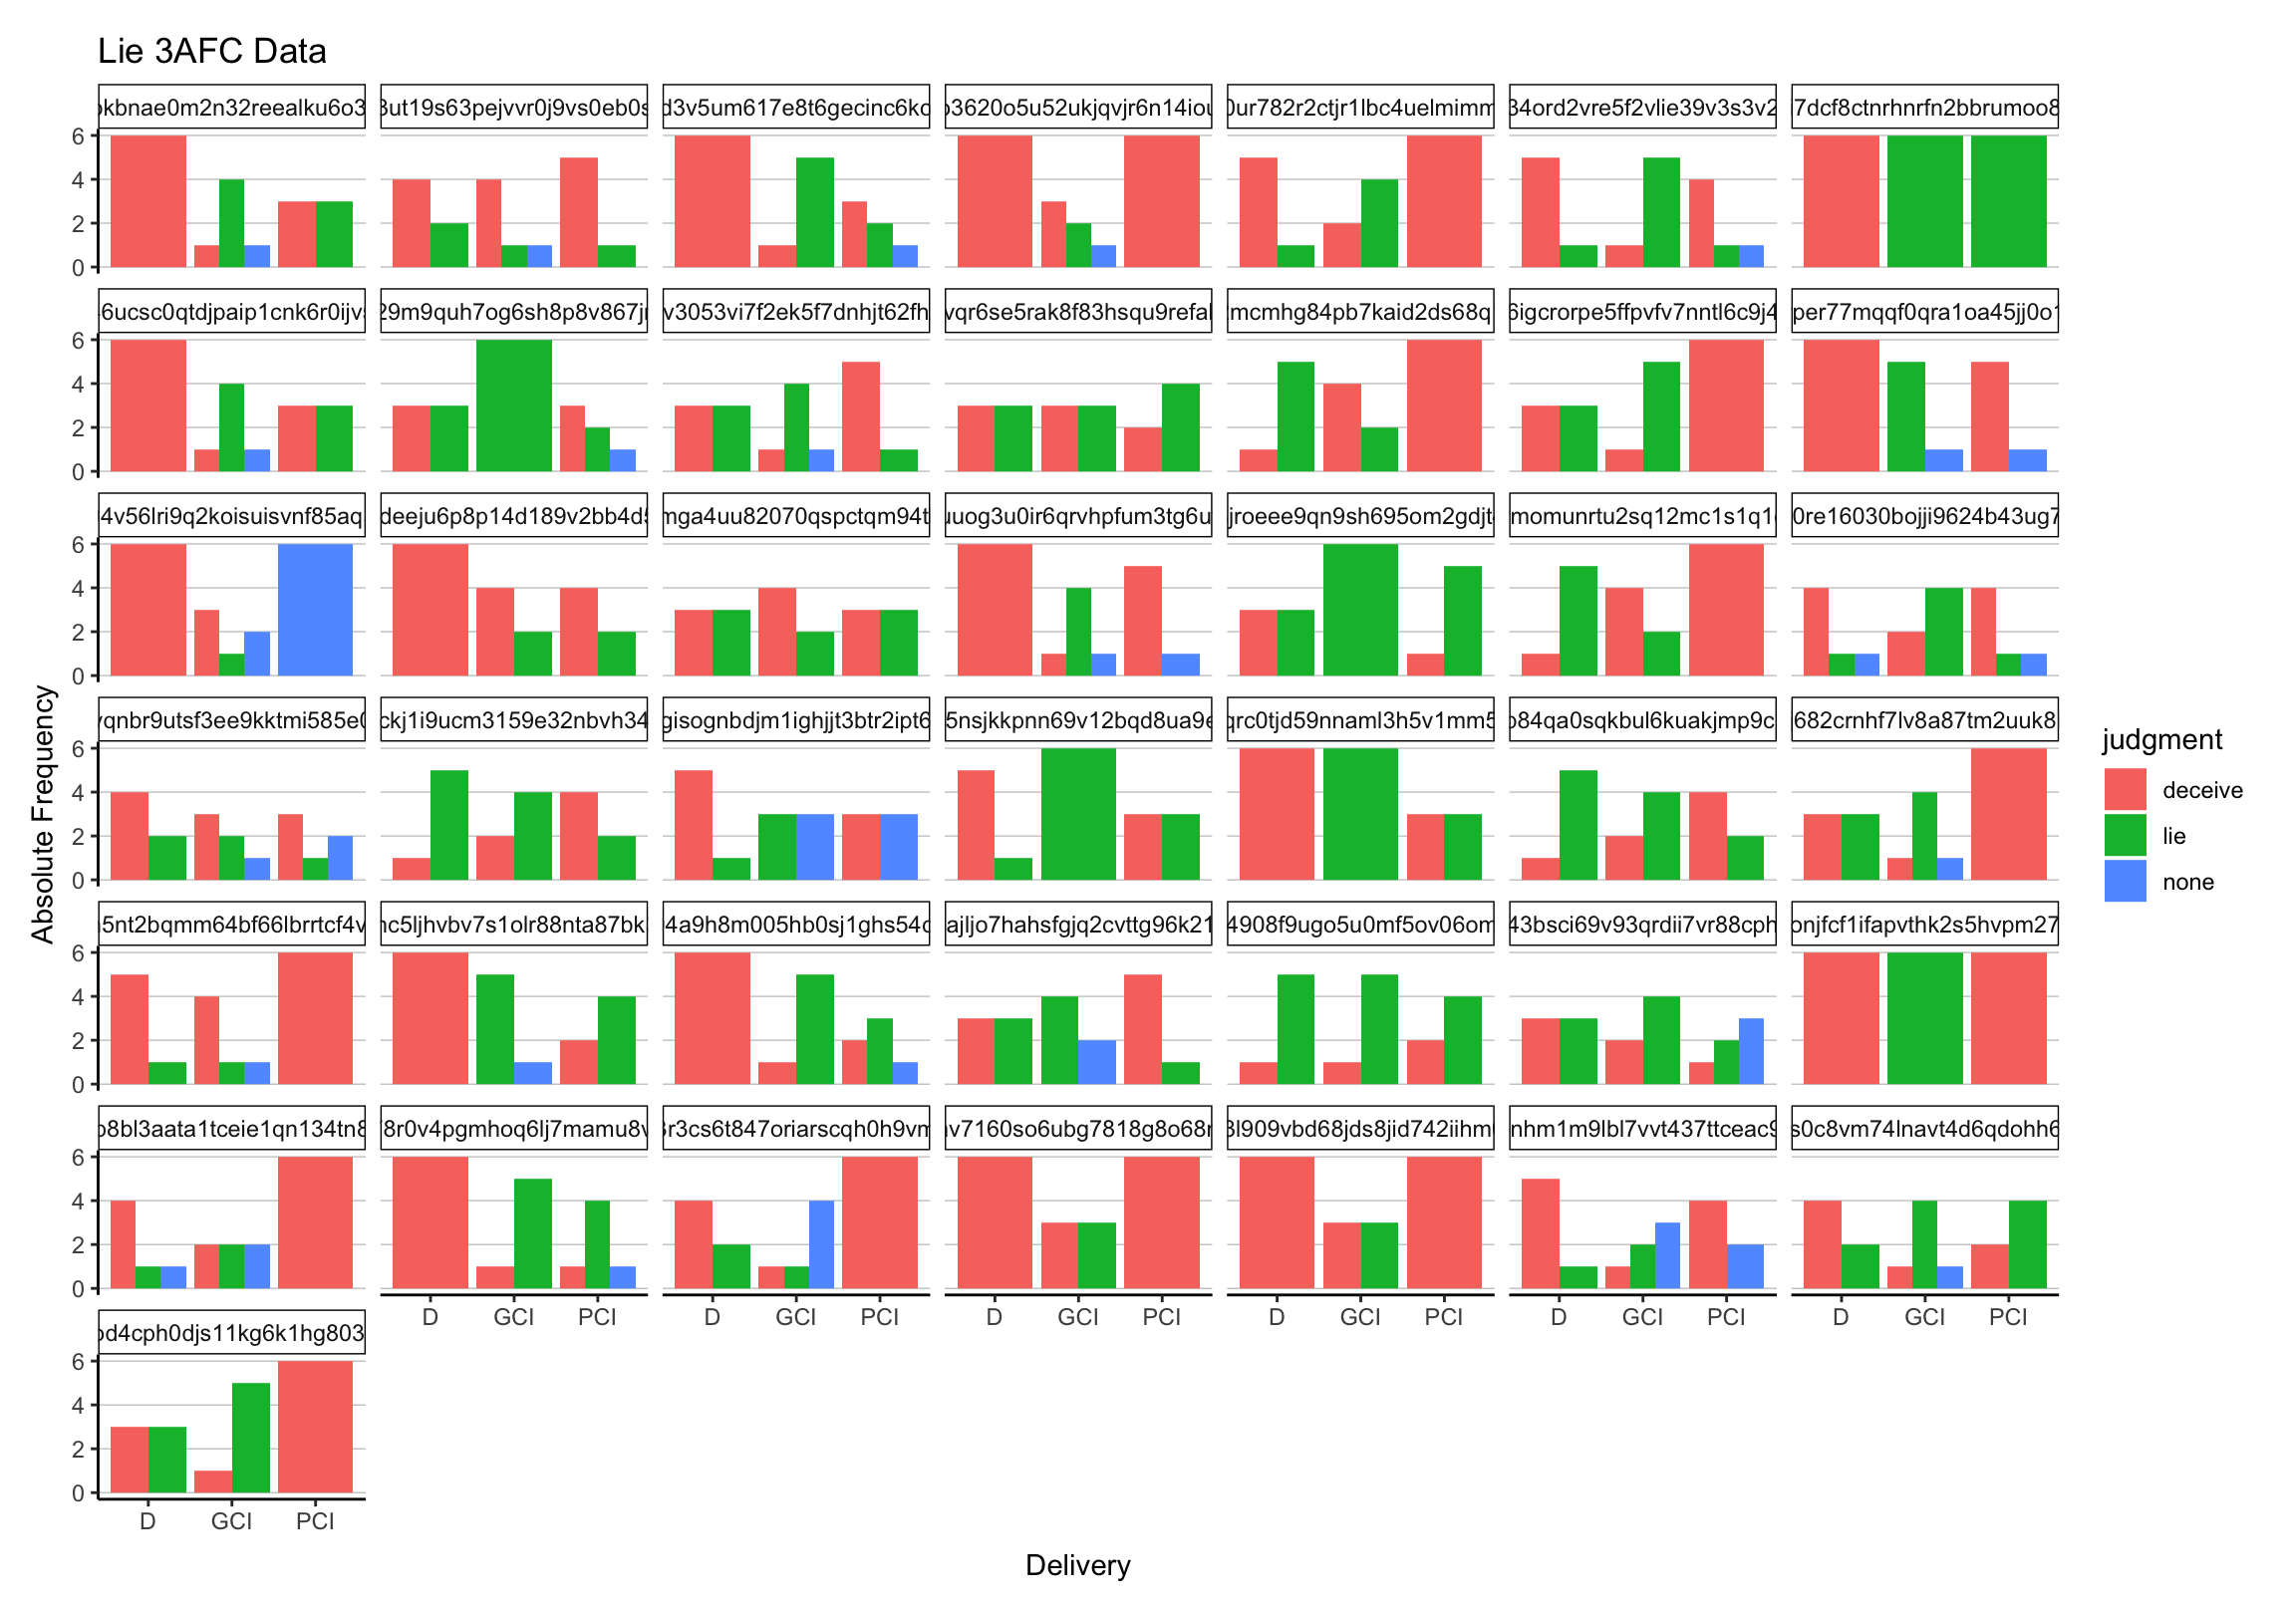
Lösung
- Baut den folgenden Plot mit “class_cl.csv” nach.
Übung II
- Baut den folgenden Plot mit “complex.csv” nach.
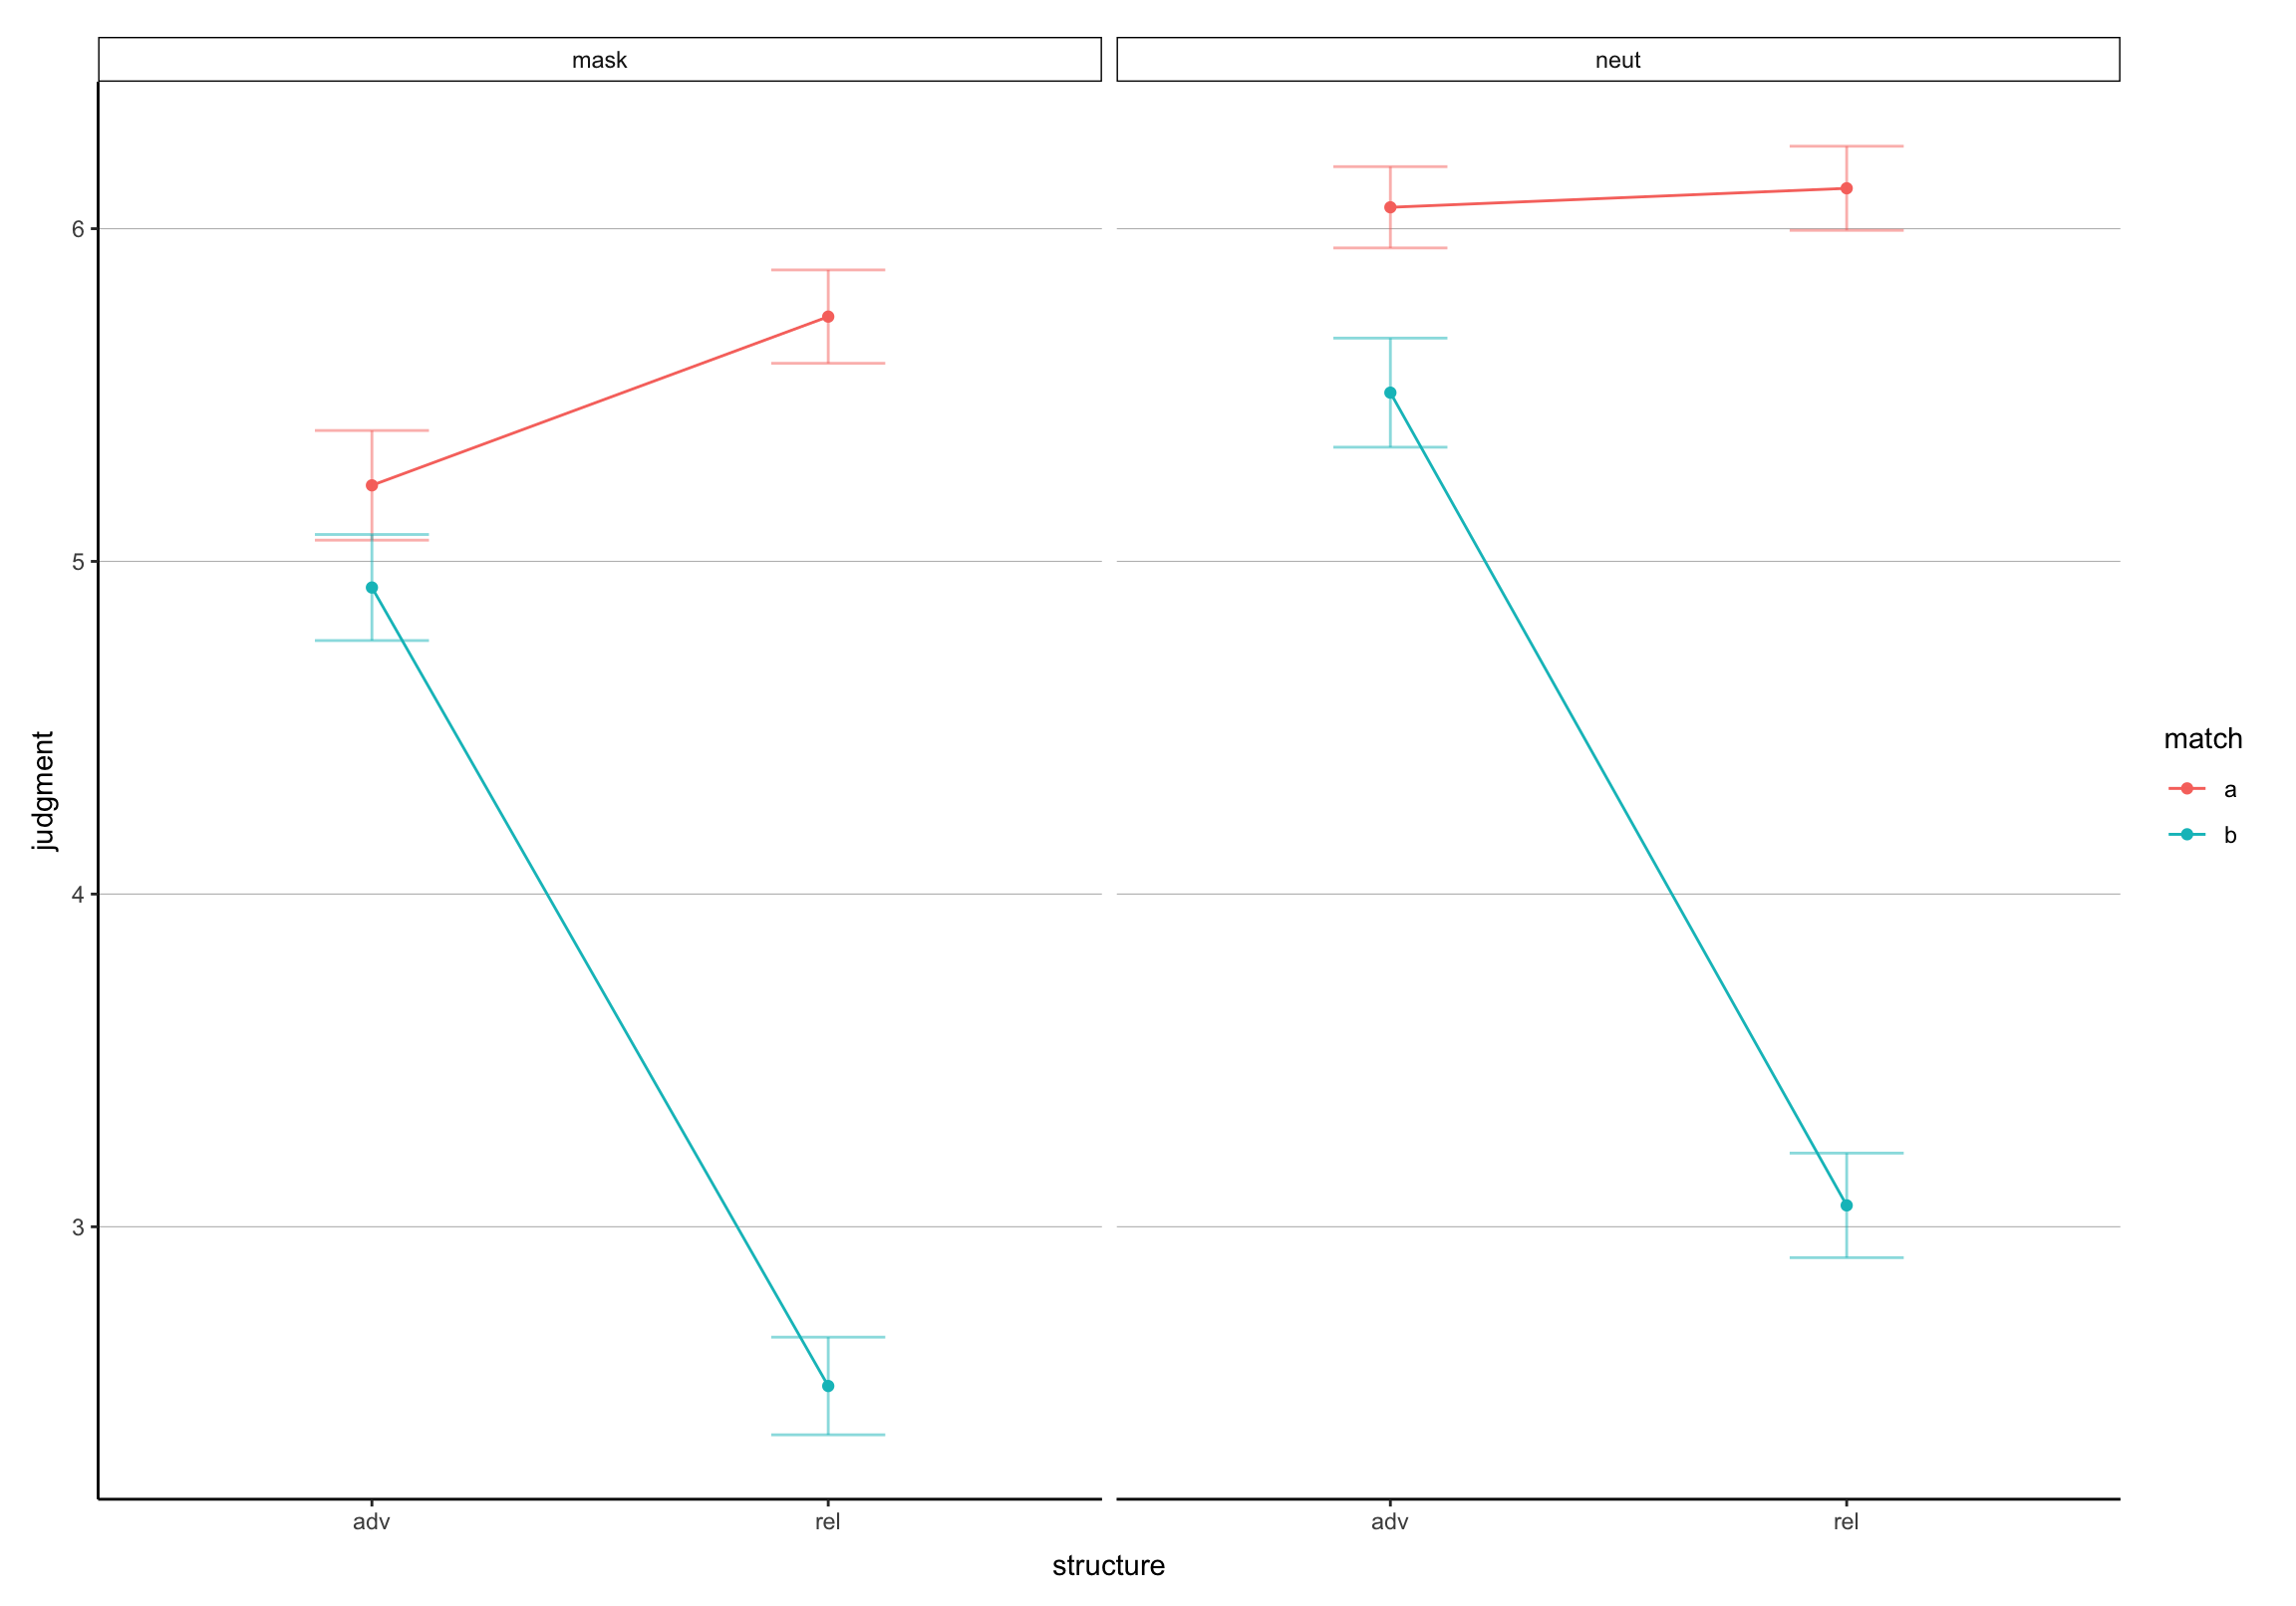
Lösung II
- Baut den folgenden Plot mit “complex.csv” nach.
d <- read.csv("docs/data/tutgg/complex.csv")


p <- ggplot(d, aes(x = structure, y = judgment,
  color = match, group = match)) +
  stat_summary(fun.y = mean, geom = "line") +
  stat_summary(fun.y = mean, geom = "point") +
  stat_summary(fun.data = mean_se, geom = "errorbar",
    width = 0.25, alpha = .5, linetype = 1) +
  facet_wrap(~gender) +
  cleanup
Bonus: Pimp My Boxplot

Paper, die ihr lesen solltet:
Weissgerber et al. (2015): Beyond Bar and Line Graphs: Time for a New Data Presentation Paradigm
Ein Video
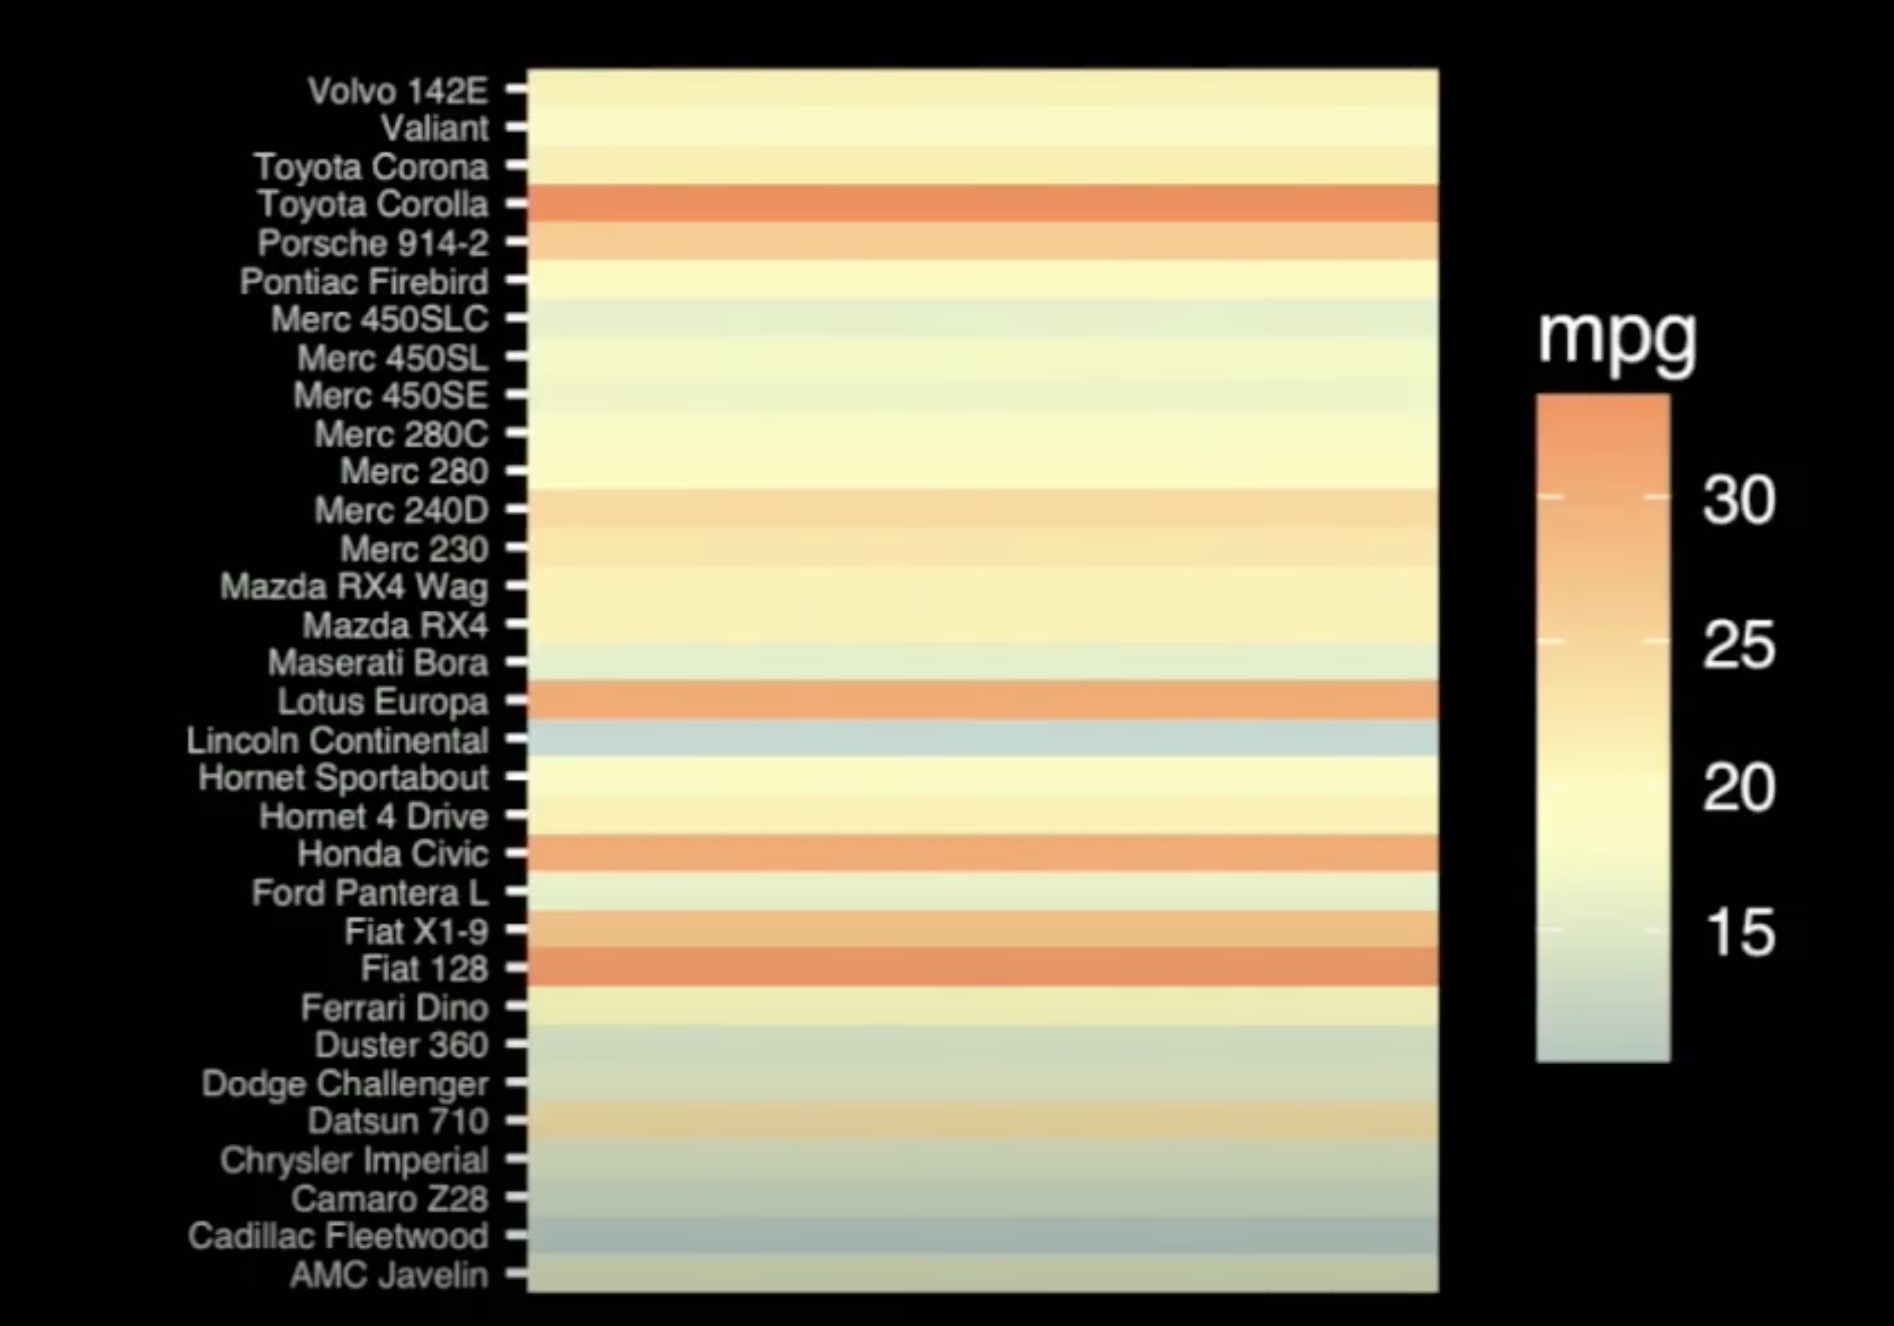
Falls ihr euch mehr darüber informieren wollt, wie die menschliche Wahrnehmung in die Visualisierung einbezogen werden kann, empfehle ich euch folgendes Video von John Rauser (2016): https://www.youtube.com/watch?v=fSgEeI2Xpdc. Darin wird z.B. erklärt, warum dieser Plot nie verwendet werden sollte.
Arbeitsstreik
Wir sehen uns nächste Woche!
